Statistical graphs and calculations chapter 7 – Casio fx-7400G PLUS Statistical Graphs and Calculations User Manual
Page 29
123
Statistical Graphs and Calculations
Chapter 7
P.118
Now you can press
f and c to view variable characteristics.
For details on the meanings of these statistical values, see “Displaying Paired-Vari-
able Statistical Results”.
k
k
k
k
k Regression Calculation
In the explanations from "Linear Regression Graph" to "Power Regression Graph,"
regression calculation results were displayed after the graph was drawn. Here, the
regression line and regression curve is represented by mathematical expressions.
You can directly determine the same expression from the data input screen.
Perform the following key operation.
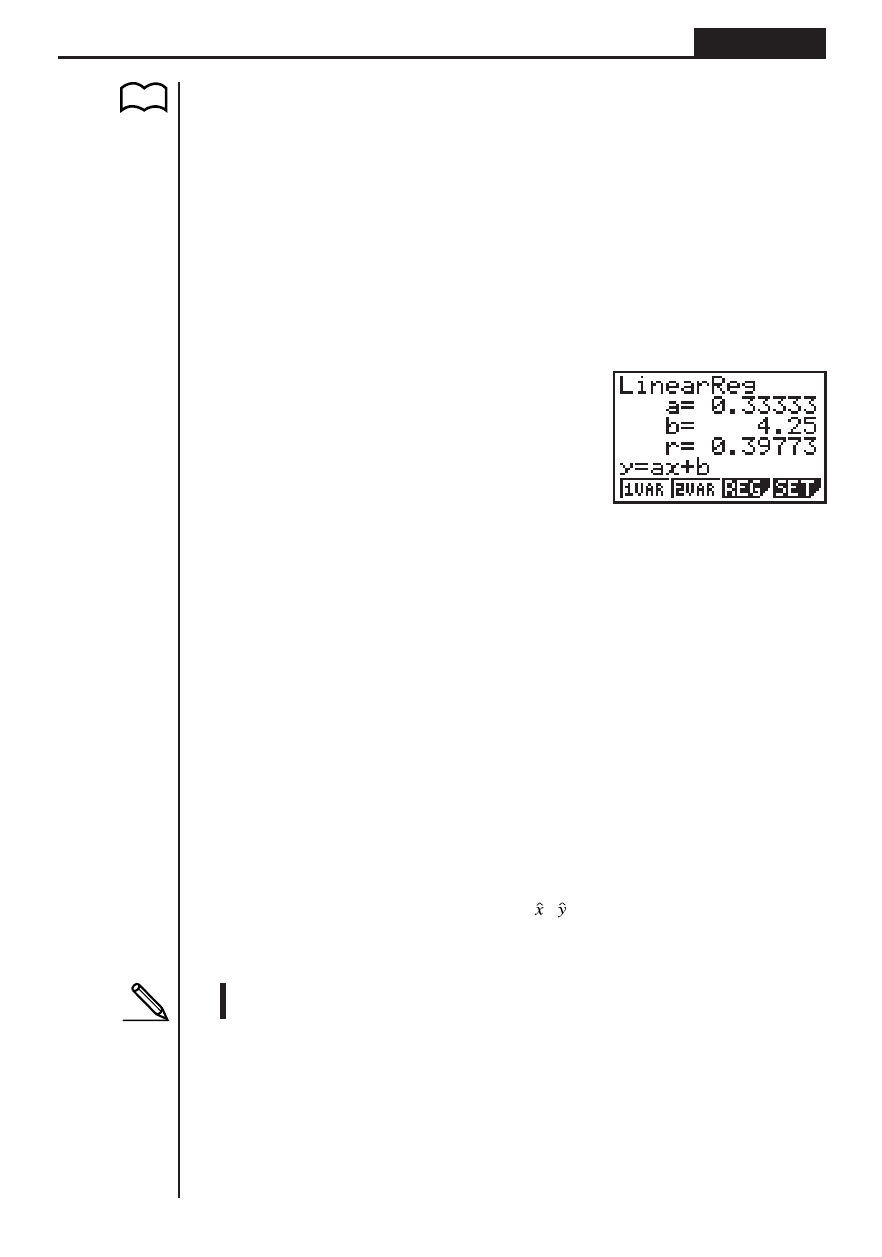
2(CALC)3(REG)
1(X)
Single variable regression parameters are displayed.
Next, you can use the following.
1 (X) ............ Linear regression
2 (Med) ........ Med-Med regression
3 (X^2) ......... Quadratic regression
[
1 (Log) ......... Logarithmic regression
2 (Exp) ......... Exponential regression
3 (Pwr) ......... Power regression
The meaning of the parameters that appear on this screen are the same as those for
“Linear Regression Graph” to “Power Regression Graph”.
k
k
k
k
k Estimated Value Calculation ( , )
After drawing a regression graph with the STAT Mode, you can use the RUN Mode
to calculate estimated values for the regression graph's
x
and
y
parameters.
• Note that you cannot obtain estimated values for Med-Med graph and quad-
ratic regression graph.