Chapter 7 statistical graphs and calculations, Kk displaying paired-variable statistical results – Casio fx-7400G PLUS Statistical Graphs and Calculations User Manual
Page 24
118
Chapter 7
Statistical Graphs and Calculations
k
k
k
k
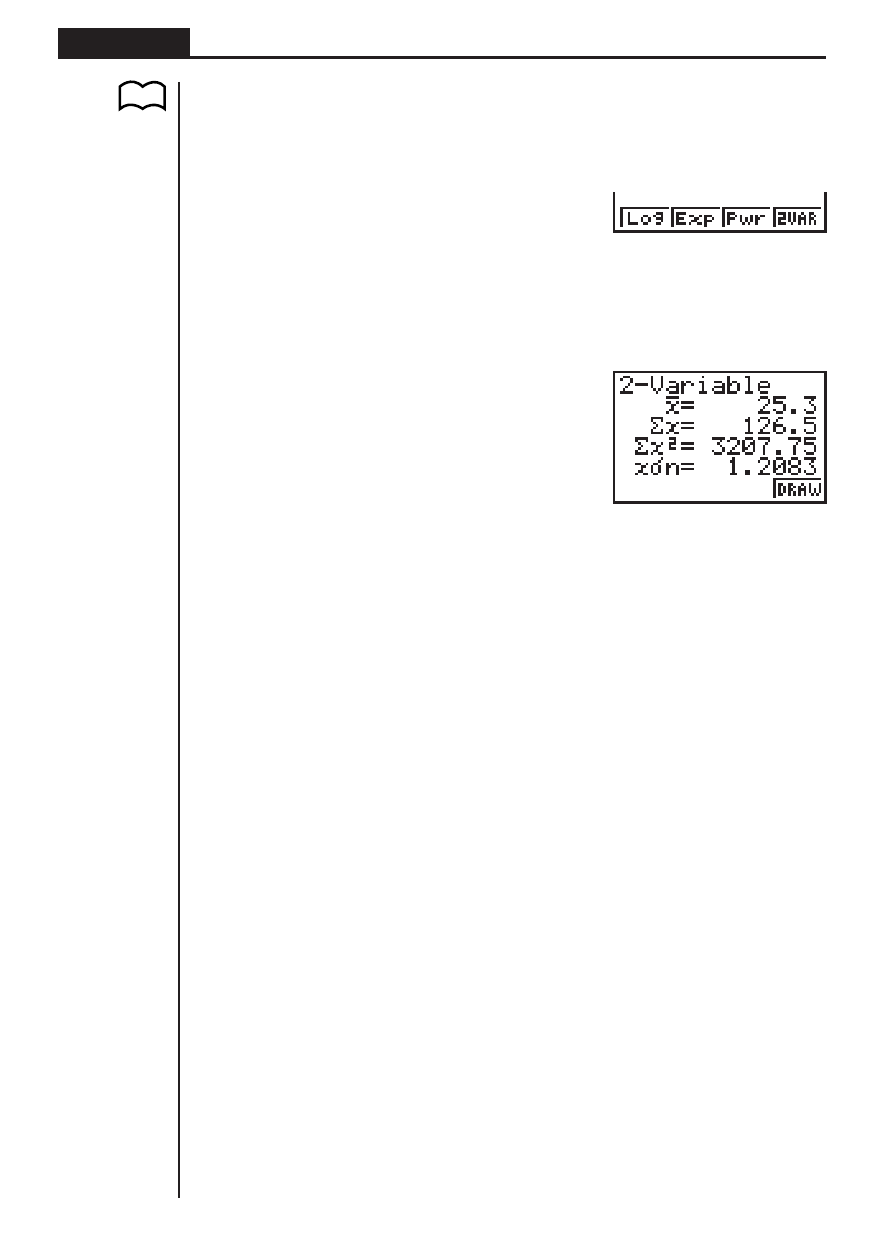
k Displaying Paired-Variable Statistical Results
Paired-variable statistics can be expressed as both graphs and parameter values.
When these graphs are displayed, the menu at the bottom of the screen appears as
below.
[
4(2VAR) ....... Paired-variable calculation result menu
Pressing 4 (2VAR) displays the following screen.
4(2VAR)
• Use
c to scroll the list so you can view the items that run off the bottom of the
screen. The following describes the meaning of each of the parameters.
_
x
...................... Mean of
x
List data
Σ
x
.................... Sum of
x
List data
Σ
x
2
.................. Sum of squares of
x
List data
x
σ
n
.................. Population standard deviation of
x
List data
x
σ
n
-1
................ Sample standard deviation of
x
List data
n
...................... Number of
x
List data items
_
y
...................... Mean of
y
List data
Σ
y
.................... Sum of
y
List data
Σ
y
2
.................. Sum of squares of
y
List data
y
σ
n
.................. Population standard deviation of
y
List data
y
σ
n
-1
................ Sample standard deviation of
y
List data
Σ
xy ..................
Sum of the product of data stored in
x
List and
y
List
minX ................ Minimum of
x
List data
maxX ............... Maximum of
x
List data
minY ................ Minimum of
y
List data
maxY ............... Maximum of
y
List data
k
k
k
k
k Copying a Regression Graph Formula to the Graph Mode
After you perform a regression calculation, you can copy its formula to the GRAPH
Mode.
The following are the functions that are available in the function menu at the bottom
of the display while regression calculation results are on the screen.
P.106
1
2
3
4