Statistical graphs and calculations chapter 7 – Casio fx-7400G PLUS Statistical Graphs and Calculations User Manual
Page 17
111
Statistical Graphs and Calculations
Chapter 7
• Only positive data can be included in a stacked bar chart. Attempting to draw a
stacked bar chart for a list that includes negative data causes an error (Ma ER-
ROR).
• A stacked bar chart cannot be superimposed with another graph.
• View Window settings are not applied to stacked bar charts.
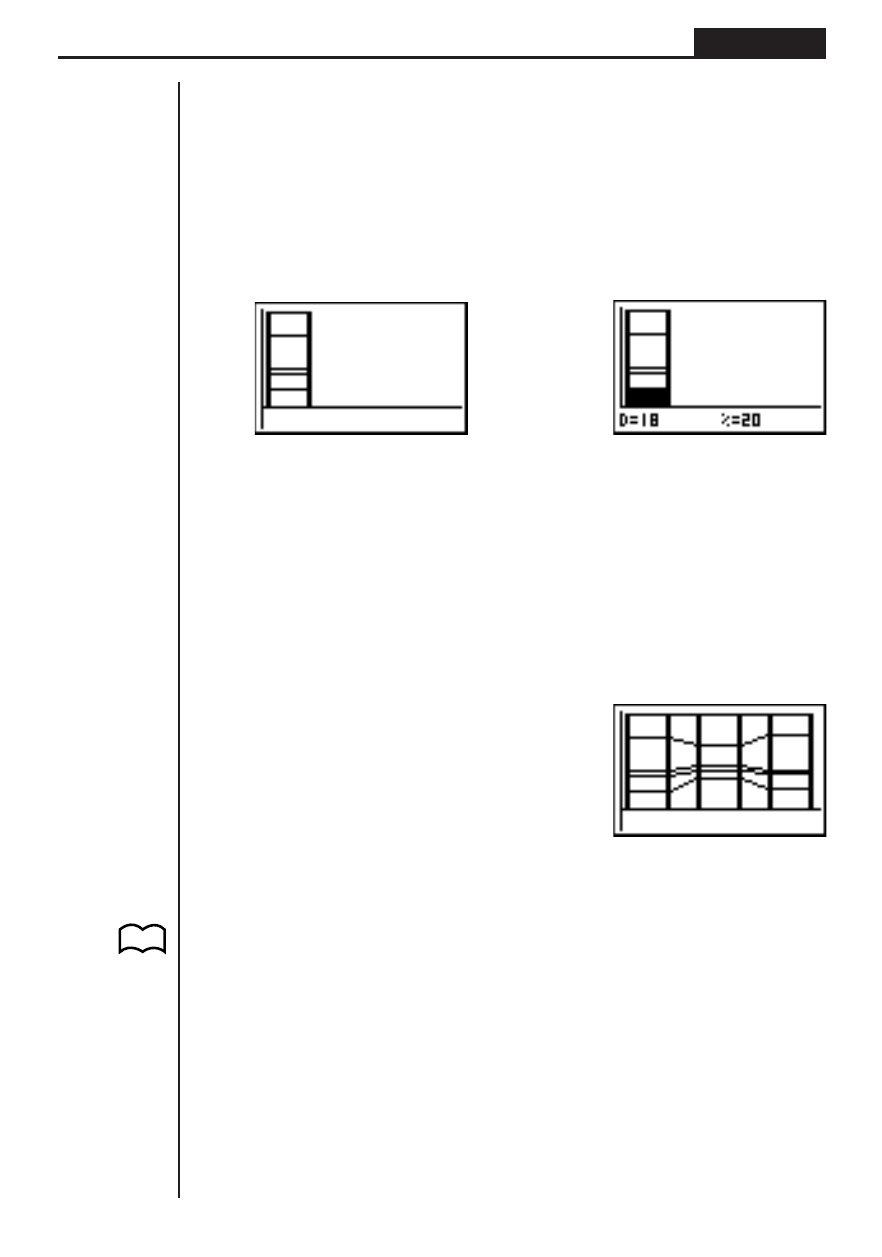
• The following display shows what happens if you perform a trace operation (!
1 (TRCE)) while a stacked bar chart is on the display.
• Pressing
f and c moves the highlighting up and down within the same graph.
• If you have multiple stacked bar charts on the screen, use
d and e to move
between them.
u
uu
u
u Linking the Segments of Stacked Bar Charts with Connecting Lines
While multiple stacked bar charts are on the display, press !4(CNCT) to link
their segments with connecting lines.
Redraw the stacked bar charts to clear the connecting lines.
k
k
k
k
k Bar Graph
From the statistical data list, press 1 (GRPH) to display the graph menu, press [
4 (SET), and then change the graph type of the graph you want to use (GPH1,
GPH2, GPH3) to bar graph.
Press Q to draw the graph.
P.101
(G-Type)
(Bar)
!1(TRCE)
R