Statistical graphs and calculations chapter 7, Kk pie chart – Casio fx-7400G PLUS Statistical Graphs and Calculations User Manual
Page 15

109
Statistical Graphs and Calculations
Chapter 7
The following describes the meaning of each of the parameters.
_
x
...................... Mean of data
Σ
x
.................... Sum of data
Σ
x
2
.................. Sum of squares
x
σ
n
.................. Population standard deviation
x
σ
n
-1
................ Sample standard deviation
n
...................... Number of data items
minX ................ Minimum
Q1 ................... First quartile
Med ................. Median
Q3 ................... Third quartile
maxX ............... Maximum
Mod ................. Mode
• Press 4 (DRAW) to return to the original single-variable statistical graph.
k
k
k
k
k Pie Chart
From the statistical data list, press 1 (GRPH) to display the graph menu, press [
4 (SET), and then change the graph type of the graph you want to use (GPH1,
GPH2, GPH3) to pie chart. Next, move the highlighting to “Display” and then press
1 or 2 to select the pie chart data format.
1 (%) ............ Displayed values show what percentage of the total data each
pie segment represents.
2 (Data) ....... Displayed values show actual data.
Press Q to draw the chart.
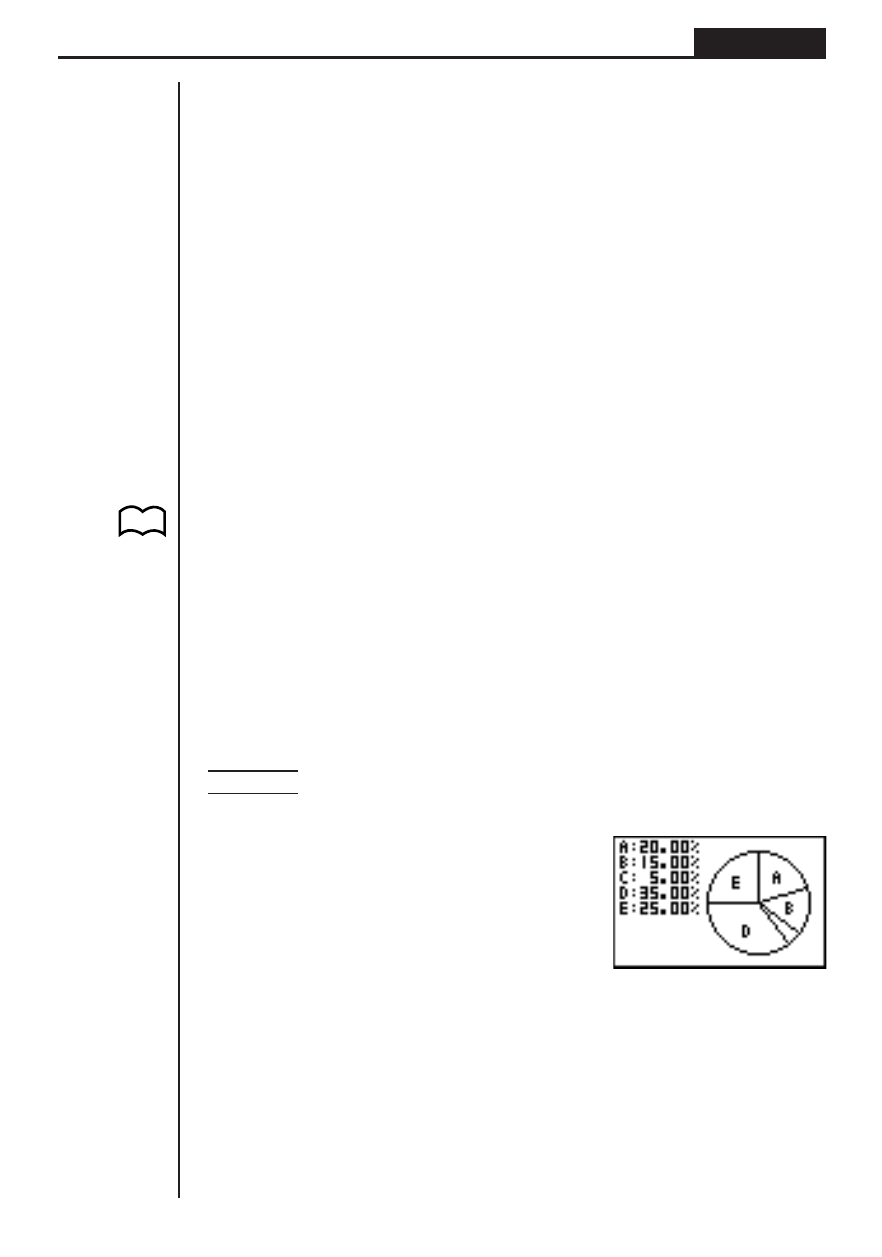
Example
To input the following data into List 1 and use it to draw a pie
chart: 18.0, 13.5, 4.5, 31.5, 22.5
1(GRPH)[4(SET)
1(GPH1)c
3(Pie)c
1(List1)c
1(%)Q
1(GRPH)1(GPH1)
• A pie chart can have up to eight data items. Attempting to draw a pie chart for a
list that has more than eight data items causes an error (Dim ERROR).
• Only positive data can be included in a pie chart. Attempting to draw a pie chart
for a list that includes negative data causes an error (Ma ERROR).
• View Window settings are not applied to pie charts.
• A pie chart cannot be superimposed with another graph.
• Values appearing on a pie chart are automatically assigned to the corresponding
variables (A, B, C, etc.)
P.100
(G-Type)
(Pie)
