Chapter 7 statistical graphs and calculations – Casio fx-7400G PLUS Statistical Graphs and Calculations User Manual
Page 4

98
Chapter 7
Statistical Graphs and Calculations
k
k
k
k
k Plotting a Scatter Diagram
It is often difficult to spot the relationship between two sets of data (such as height
and shoe size) by simply looking at the numbers. Such relationships often become
clear however, when we plot the data on a graph, using one set as
x
-values and the
other set as
y
-values.
u
uu
u
uTo plot a scatter diagram
Example
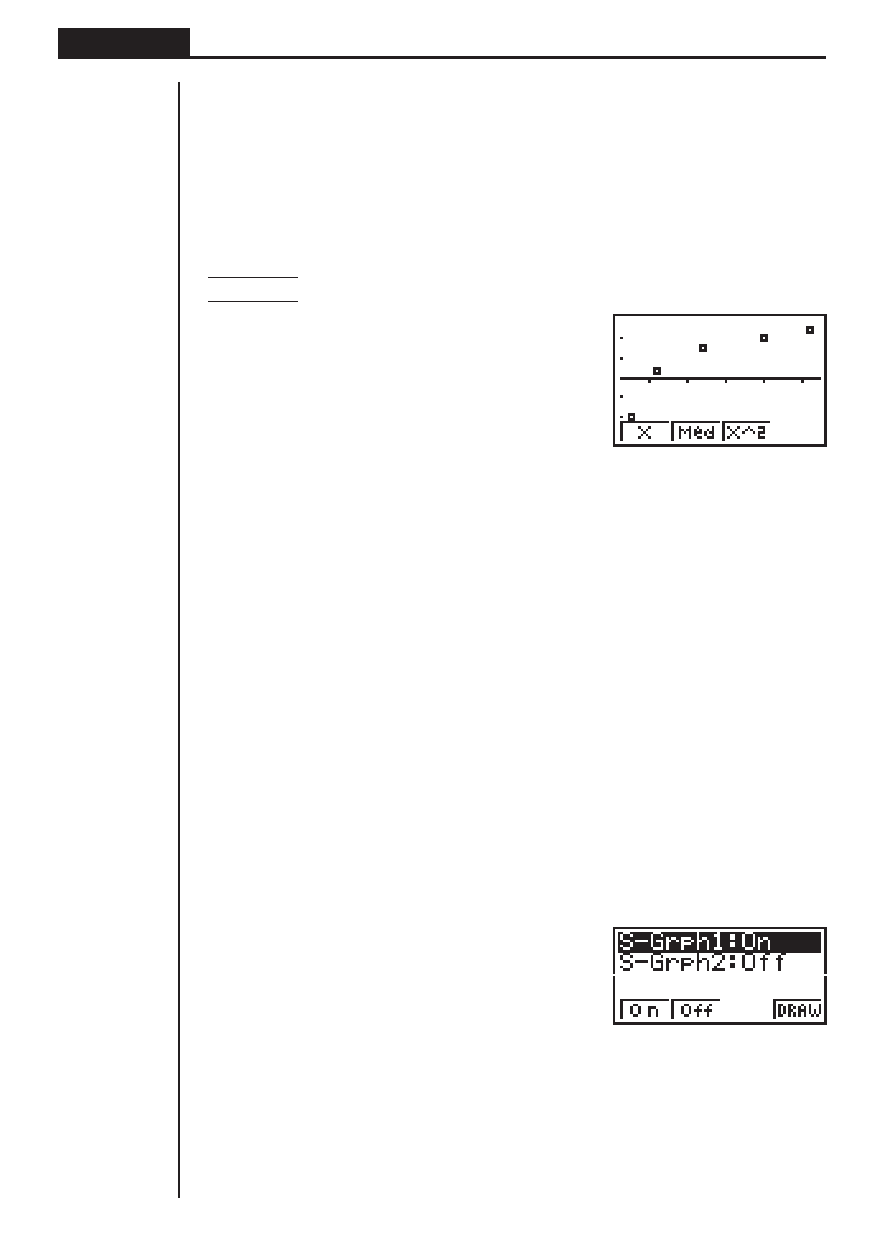
To plot the data we input in statistical data List 1 and List 2
1(GPH1)
• The default setting automatically uses List 1 data as
x
-axis values and List 2 data
as
y
-axis values. Each set of
x
/
y
data is a point on the scatter diagram.
• To return to the statistical data list, press Q.
k
k
k
k
k Changing Graph Parameters
Use the following procedures to specify the graph draw/non-draw status, the graph
type, and other general settings for each of the graphs in the graph menu (GPH1,
GPH2, GPH3).
1. Graph draw/non-draw status (SELECT)
The following procedure can be used to specify the draw (On)/non-draw (Off) status
of each of the graphs in the graph menu.
u
uu
u
uTo specify the draw/non-draw status of a graph
1. While the graph menu is on the display, press [1 (SEL) to display the graph
On/Off screen.
1(GRPH)
[1(SEL)
1 (On) .......... Graph On (graph draw)
2 (Off) .......... Graph Off (graph non-draw)
4 (DRAW) .... Draw all On graphs
• Note that the S-Grph1 setting is for Graph 1 (GPH1 of the graph menu), S-Grph2
is for Graph 2, and S-Grph3 is for Graph 3.
1
2
3
4
