Chapter 7 statistical graphs and calculations – Casio fx-7400G PLUS Statistical Graphs and Calculations User Manual
Page 28
122
Chapter 7
Statistical Graphs and Calculations
The following is the meaning for each item.
1VarX .............. Specifies list where single-variable statistic
x
values (XList)
are located.
1VarF .............. Specifies list where single-variable frequency values (Fre-
quency) are located.
2VarX .............. Specifies list where paired-variable statistic
x
values (XList)
are located.
2VarY .............. Specifies list where paired-variable statistic
y
values (YList)
are located.
2VarF .............. Specifies list where paired-variable frequency values (Fre-
quency) are located.
• Calculations in this section are performed based on the above specifications.
k
k
k
k
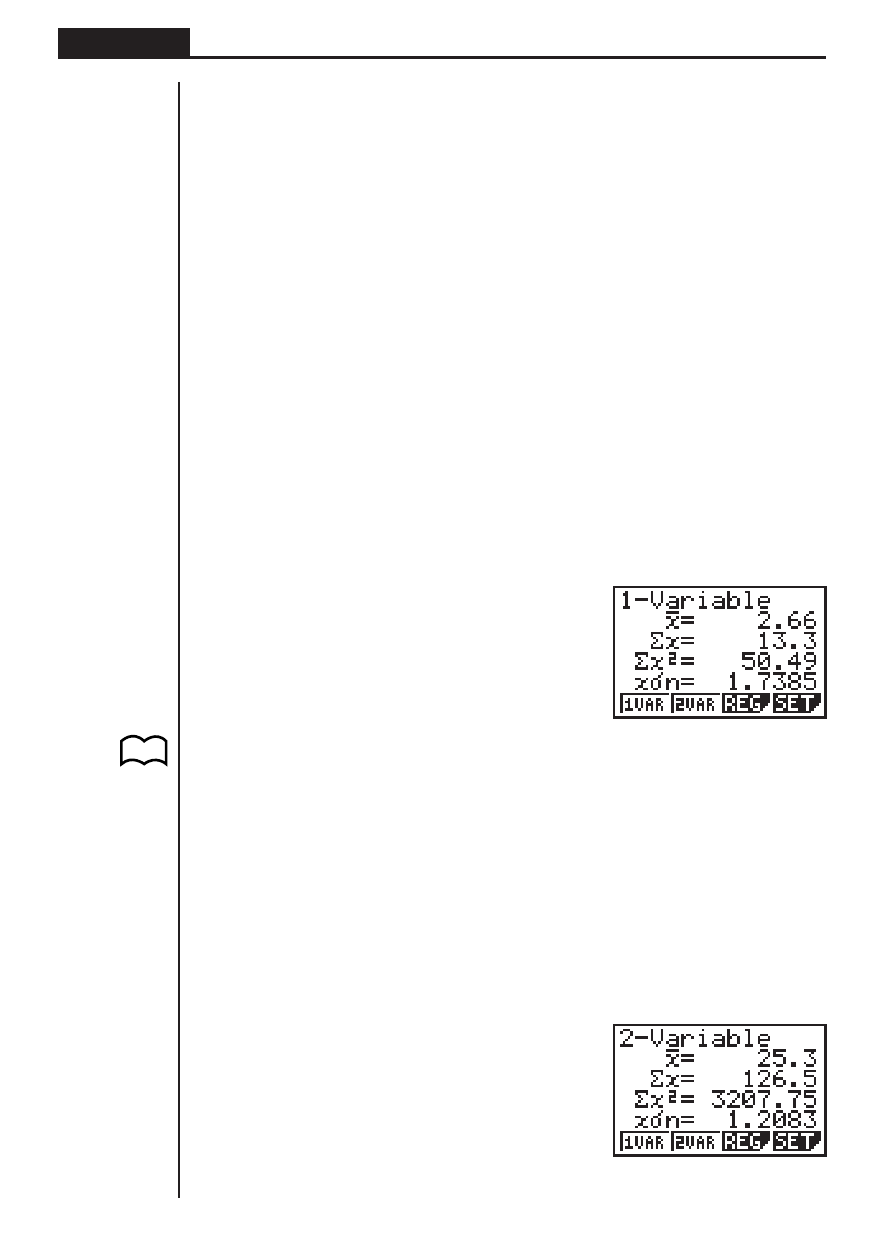
k Single-Variable Statistical Calculations
In the previous examples from “Histogram” to “Normal Distribution Curve,” statistical
calculation results were displayed after the graph was drawn. These were numeric
expressions of the characteristics of variables used in the graphic display.
The following operation produces the same values directly from the statistical data
list.
2(CALC)1(1VAR)
Now you can press
f and c to view variable characteristics.
For details on the meanings of these statistical values, see “Displaying Single-Vari-
able Statistical Results”.
k
k
k
k
k Paired-Variable Statistical Calculations
In the previous examples from “Linear Regression Graph” to “Power Regression
Graph,” statistical calculation results were displayed after the scatter diagram was
drawn. These were numeric expressions of the characteristics of variables used in
the graphic display.
The following operation produces the same values directly from the statistical data
list.
2(CALC)2(2VAR)
P.108