Chapter 7 statistical graphs and calculations, Kk line graph – Casio fx-7400G PLUS Statistical Graphs and Calculations User Manual
Page 18
112
Chapter 7
Statistical Graphs and Calculations
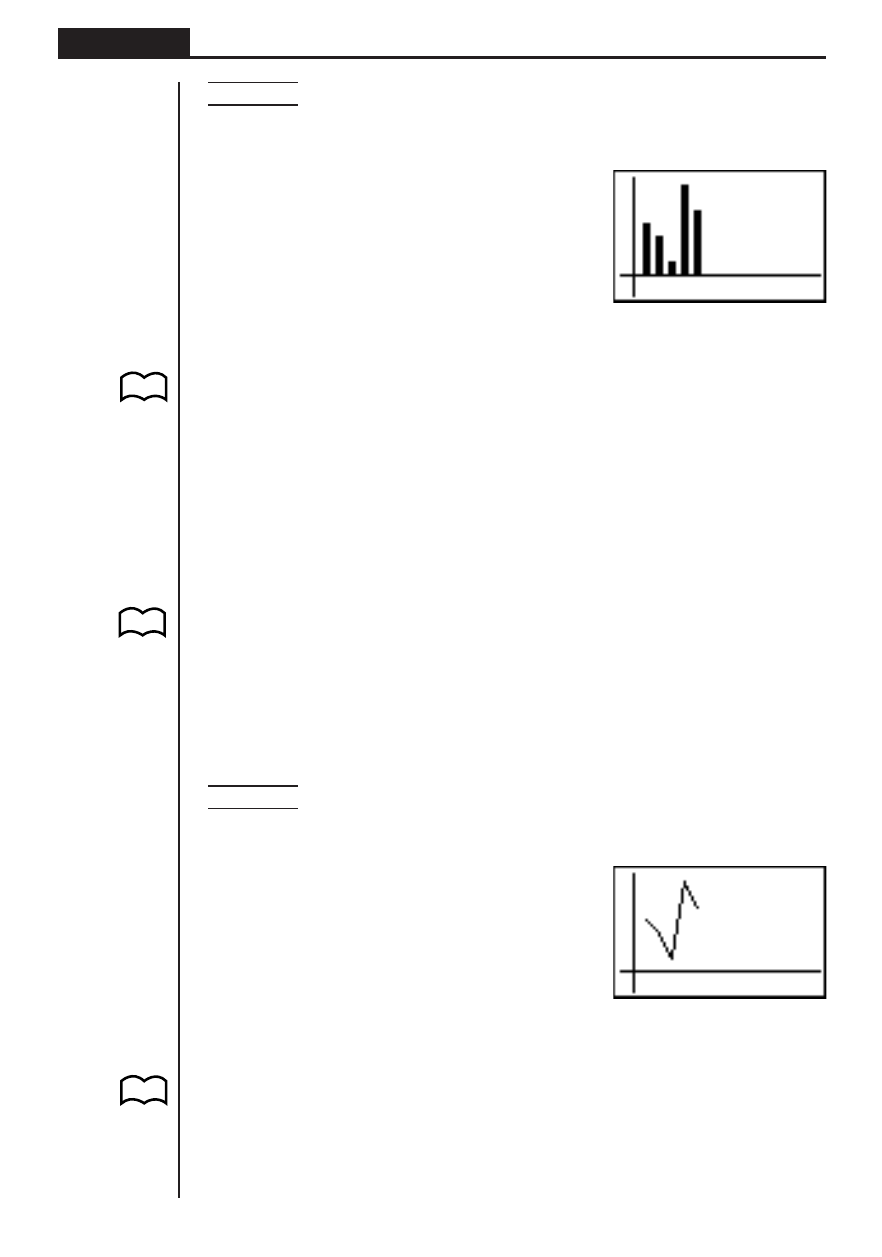
Example
To input the following data into List 1 and use it to draw a bar
graph: 18.0, 13.5, 4.5, 31.5, 22.5
1(GRPH)[4(SET)
1(GPH1)c
[[[[1(Bar)c
1(List1)Q
1(GRPH)1(GPH1)
• A bar graph can have up to 14 data items. Attempting to draw a bar graph for a
list that has more than 14 data items causes an error (Dim ERROR).
• The
x
-axis of a bar graph is fixed. The
y
-axis is controlled by View Window set-
tings only when Man (manual) is specified for the S-Wind (Statistical Graph View
Window Setting) on the Set Up screen.
• A bar graph can be superimposed with a line graph only. This is done by selecting
3 (Both) while specifying the graph type.
• Pressing ! 1 (TRCE) while a bar graph is on the display activates the trace
operation. Use
d and e to move the pointer.
• You cannot draw multiple bar graphs on the same screen.
k
k
k
k
k Line Graph
From the statistical data list, press 1 (GRPH) to display the graph menu, press [
4 (SET), and then change the graph type of the graph you want to use (GPH1,
GPH2, GPH3) to line graph.
Press Q to draw the graph.
Example
To input the following data into List 1 and use it to draw a line
graph: 18.0, 13.5, 4.5, 31.5, 22.5
1(GRPH)[4(SET)
1(GPH1)c
[[[[2(Line)c
1(List1)Q
1(GRPH)1(GPH1)
• A line graph can have up to 14 data items. Attempting to draw a line graph for a
list that has more than 14 data items causes an error (Dim ERROR).
• The
x
-axis of a line graph is fixed. The
y
-axis is controlled by View Window set-
tings only when Man (manual) is specified for the S-Wind (Statistical Graph View
Window Setting) on the Set Up screen.
• A line graph can be superimposed with a bar graph only. This is done by selecting
3 (Both) while specifying the graph type.
P.8
P.8
P.101
(G-Type)
(Line)