Casio ClassPad II fx-CP400 Examples User Manual
Page 27
Chapter 7: Statistics Application
27
0704
1. On the Stat Editor window, tap ~ to display the Main application work area
window.
2. Input the matrix
11
68 3
9 23 5
and assign it to variable
a
(see “2-5 Matrix and
Vector Calculations” in the User’s Guide).
3. Tap the Stat Editor window to make it active.
4. Tap [Calc] - [Test] - [
χ
2
Test] and then tap [Next>>].
5. Input “a” in the Matrix dialog box, and then tap [Next>>].
• This displays the calculation results.
6. Tap $ to graph the results.
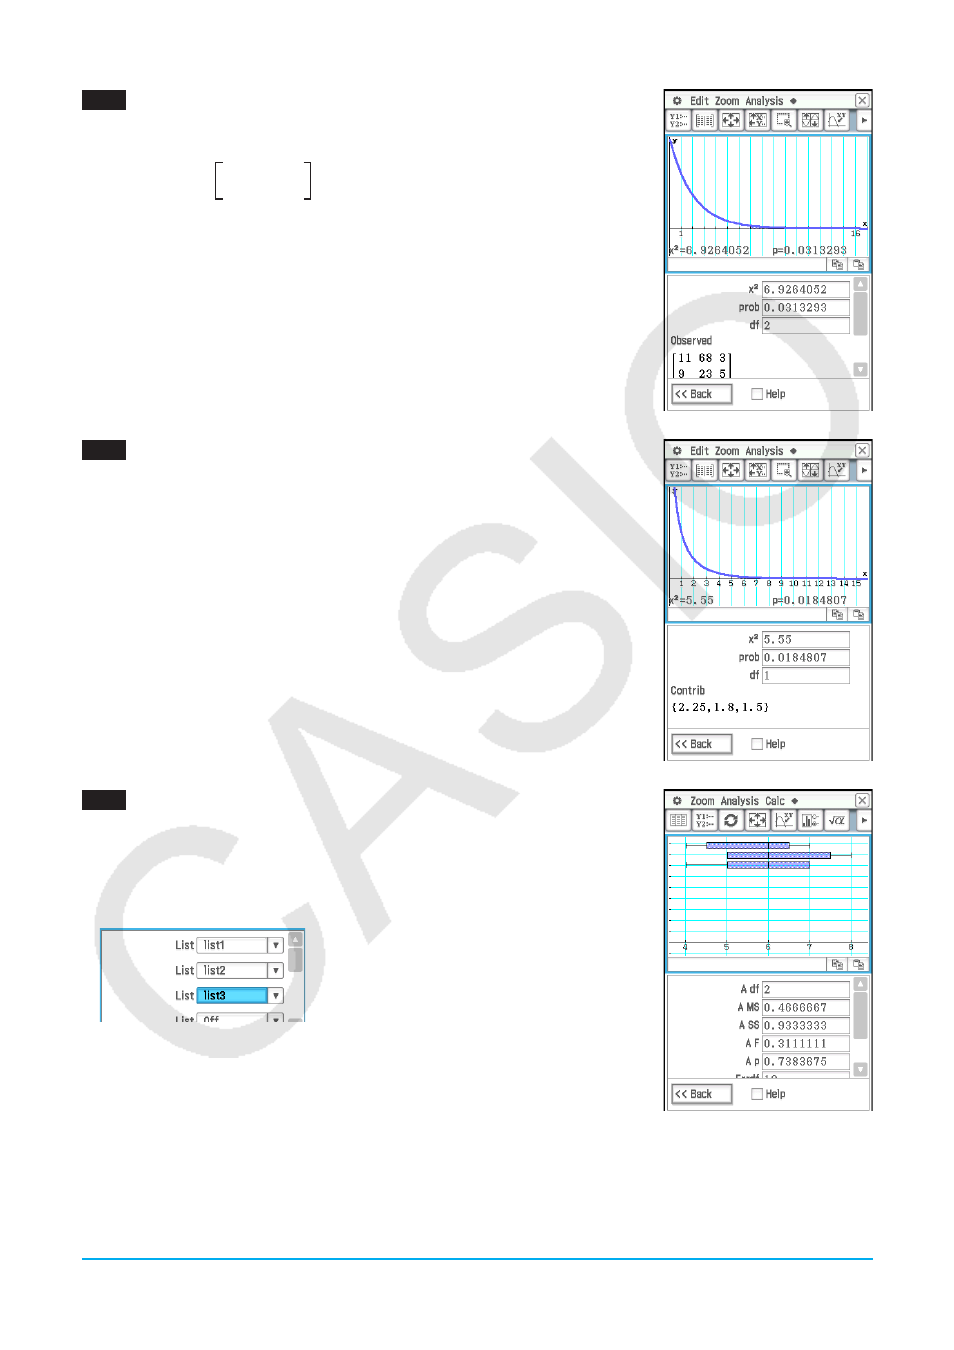
0705
1. On the Stat Editor window, tap ~ to display the Main application work area
window.
2. Assign {1,2,3} to list1 and {4,5,6} to list2 (see “2-4 List Calculations” in the
User’s Guide).
3. Tap the Stat Editor window to make it active.
4. Tap [Calc] - [Test] - [
χ
2
GOF Test] and then tap [Next>>].
5. Leaving “Observed” (list1) and “Expected” (list2) at their initial default
settings, input 1 for “df”.
6. Tap [Next>>] to display the calculation results.
7. Tap $ to graph the results.
0706
1. Input the list data into [list1], [list2] and [list3] in the Stat Editor.
list1 = {7,4,6,6,5}, list2 = {6,5,5,8,7}, list3 = {4,7,6,7,6}
2. Tap [Calc] - [Test] - [One-Way ANOVA] and then tap [Next>>].
3. Select Lists [list1], [list2], and [list3].
4. Tap [Next>>] to display the calculation results.
5. Tap $ to graph the results.
LY777Ex_E.indb 27
13/02/25 11:24