Chapter 7: statistics application – Casio ClassPad II fx-CP400 Examples User Manual
Page 26
Chapter 7: Statistics Application
26
Chapter 7:
Statistics Application
0701
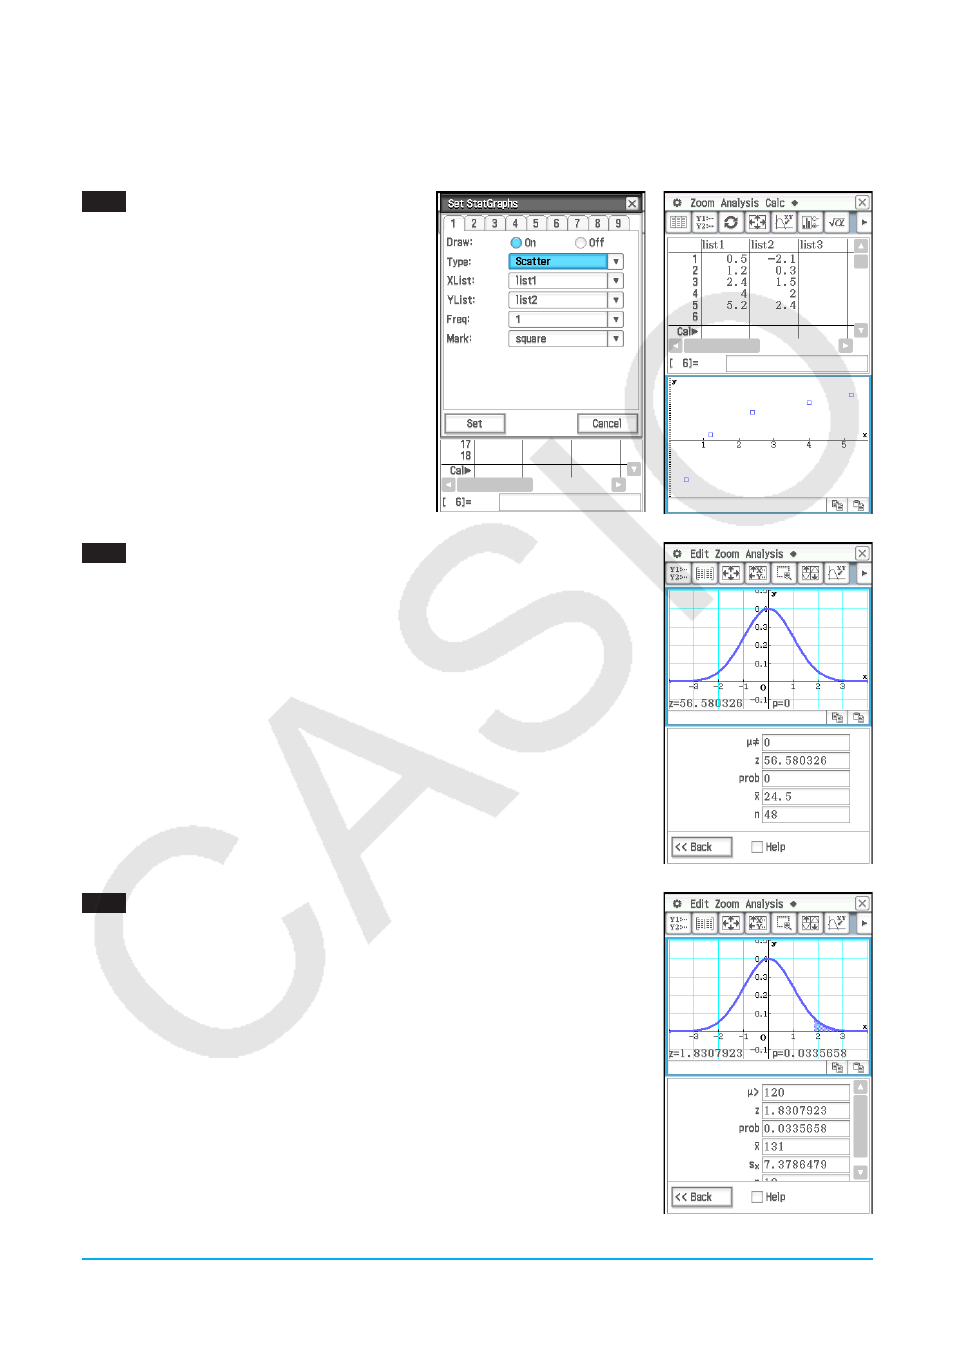
1. On the Stat Editor window, input the two lists
(list1 = 0.5, 1.2, 2.4, 4.0, 5.2, list2 = −2.1,
0.3, 1.5, 2.0, 2.4).
2. Tap G to display the Set StatGraphs dialog
box.
3. Configure the settings shown in the screen
to the right and then tap [Set].
4. Tap
y to draw the scatter plot.
0702
1. On the Stat Editor window, tap [Calc] - [Test] .
2. Select [One-Sample Z-Test] and [Variable], and then tap [Next>>].
3. Select the
ƫ
condition [ ] and input values.
ƫ
0
= 0,
σ = 3, o = 24.5,
n
= 48
4. Tap [Next>>] to display the calculation results.
5. Tap $ to graph the results.
0703
1. Input the list data into [list1] and [list2] in the Stat Editor.
list1 = {120,125,130,135,140,145}, list2 = {1,2,4,1,1,1}
2. Tap [Calc] - [Test].
3. Select [One-Sample Z-Test] and [List], and then tap [Next>>].
4. Select the
ƫ
condition [>] and input values.
ƫ
0
= 120,
σ = 19
5. Select List [list1] and Freq [list2].
6. Tap [Next>>] to display the calculation results.
7. Tap $ to graph the results.
LY777Ex_E.indb 26
13/02/25 11:24