Casio ClassPad II fx-CP400 Examples User Manual
Page 16
Chapter 3: Graph & Table Application
16
0312
1. If the graph controller is not displayed on the Graph window, perform the operation below.
(1) Tap
O and then [Graph Format] to display the Graph Format dialog box.
(2) Select the “G-Controller” check box.
(3) Tap [Set].
2. On the Graph Editor window, input 2
x
2
+ 3
x
– 1 in line
y
1, and 2
x
+ 1 in line
y
2.
3. Tap $ to graph the function.
4. Tap [Analysis] and then [Modify].
• This displays a dialog box for inputting the step.
5. Input the amount of change (step) in the coefficient value, and then tap [OK].
• This causes “Modify” to appear on the Graph window and the
y
1 graph (2
x
2
+ 3
x
– 1) to become active,
which is indicated by a thick graph line.
• The function of the currently active graph is displayed in the Graph window message box.
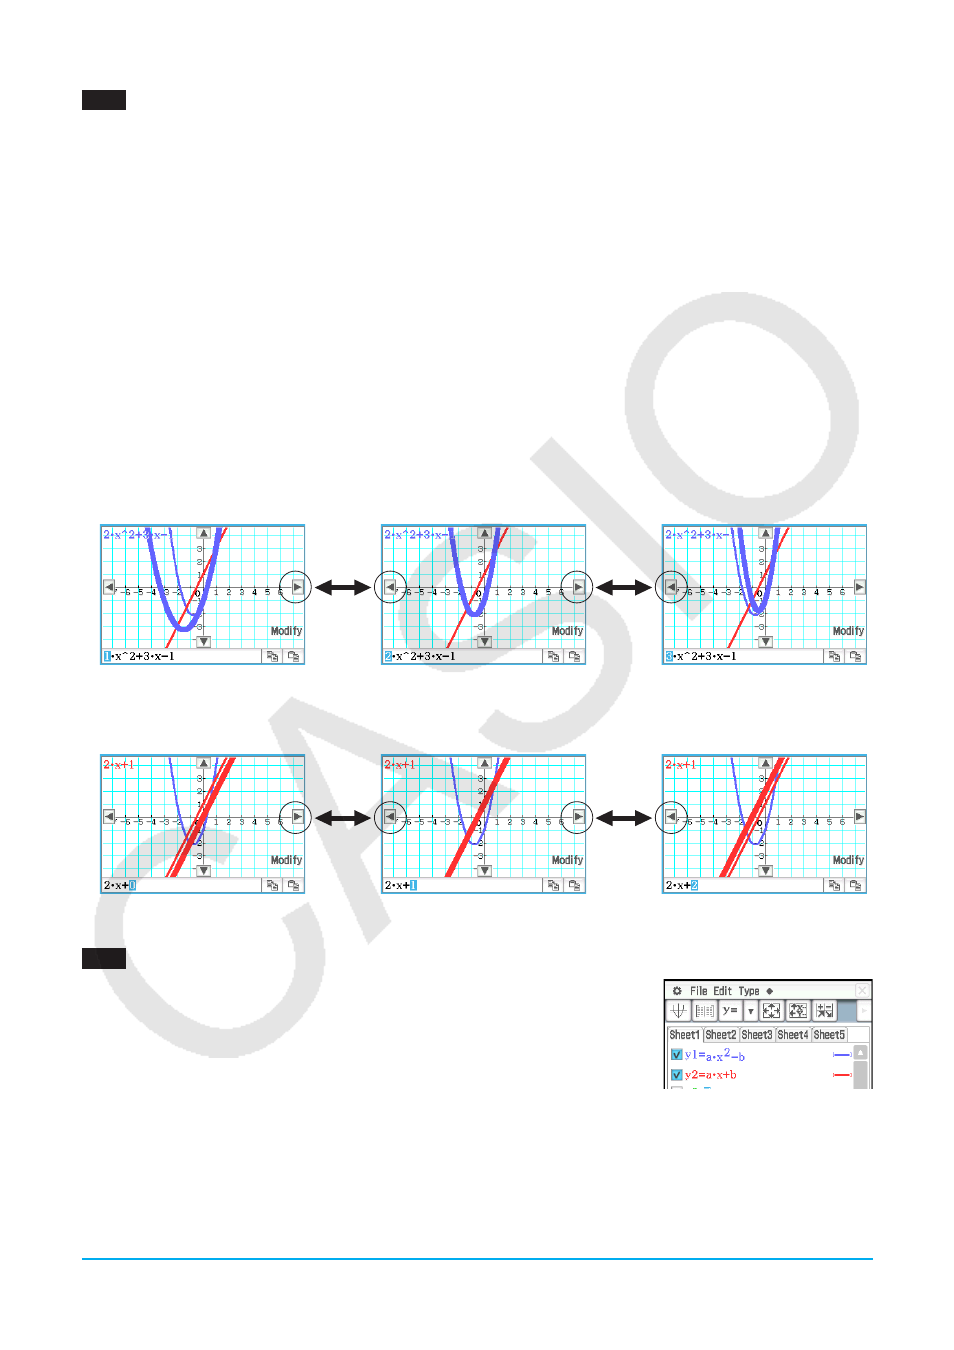
6. In the function displayed in the message box, select the coefficient you want to change.
7. Tap the left or right graph controller button to change the value of the coefficient you selected in step 5.
• To increase the value of the coefficient, tap the right graph controller arrow.
• To decrease the value of the coefficient, tap the left graph controller arrow.
• At this point, you could select other coefficients and change their values as well, if you want.
8. To modify the
y
2 graph (2
x
+ 1), tap the down graph controller arrow to make it the graph active.
• Repeat steps 6 and 7 to modify the currently selected graph.
9. To quit graph modification, tap
l on the icon panel.
0313
1. On the Graph Editor window, input
a
ؒ
x
2
–
b
in line
y
1, and
a
ؒ
x
+
b
in line
y
2.
2. Tap
O and then [Main] to display the Main application window.
• For details about using the Main application, see Chapter 2 in the User’s
Guide.
3. Use the Main application work area to assign values to variables “
a
” and “
b
”
(
a
= 1 and
b
= 2 in this example).
bWaw cWbw
4. Tap the Graph Editor window to make it active.
5. Tap $ to graph the function.
6. Tap
a and then [Dynamic Graph]. This displays the Dynamic Graph dialog box.
LY777Ex_E.indb 16
13/02/25 11:23