Charts and meters, Charts, Charts and meters…… 12 – Measurement Computing DaqView for DaqTemp Applications User Manual
Page 14
DaqView, pg. 12
967996
DaqTemp Applications
Charts and Meters
When you select one of the first four buttons from the main widow you access one of the following types of
display window:
Charts
Analog Meters
Bar Graph Meters
Digital Meters
Each of these display options is detailed shortly. Additional tool icons in charts and meters include the
following. Note that other buttons, for DaqViewXL and the post-acquisition data analysis program, are
discussed later.
Control Buttons for Charts and Meters
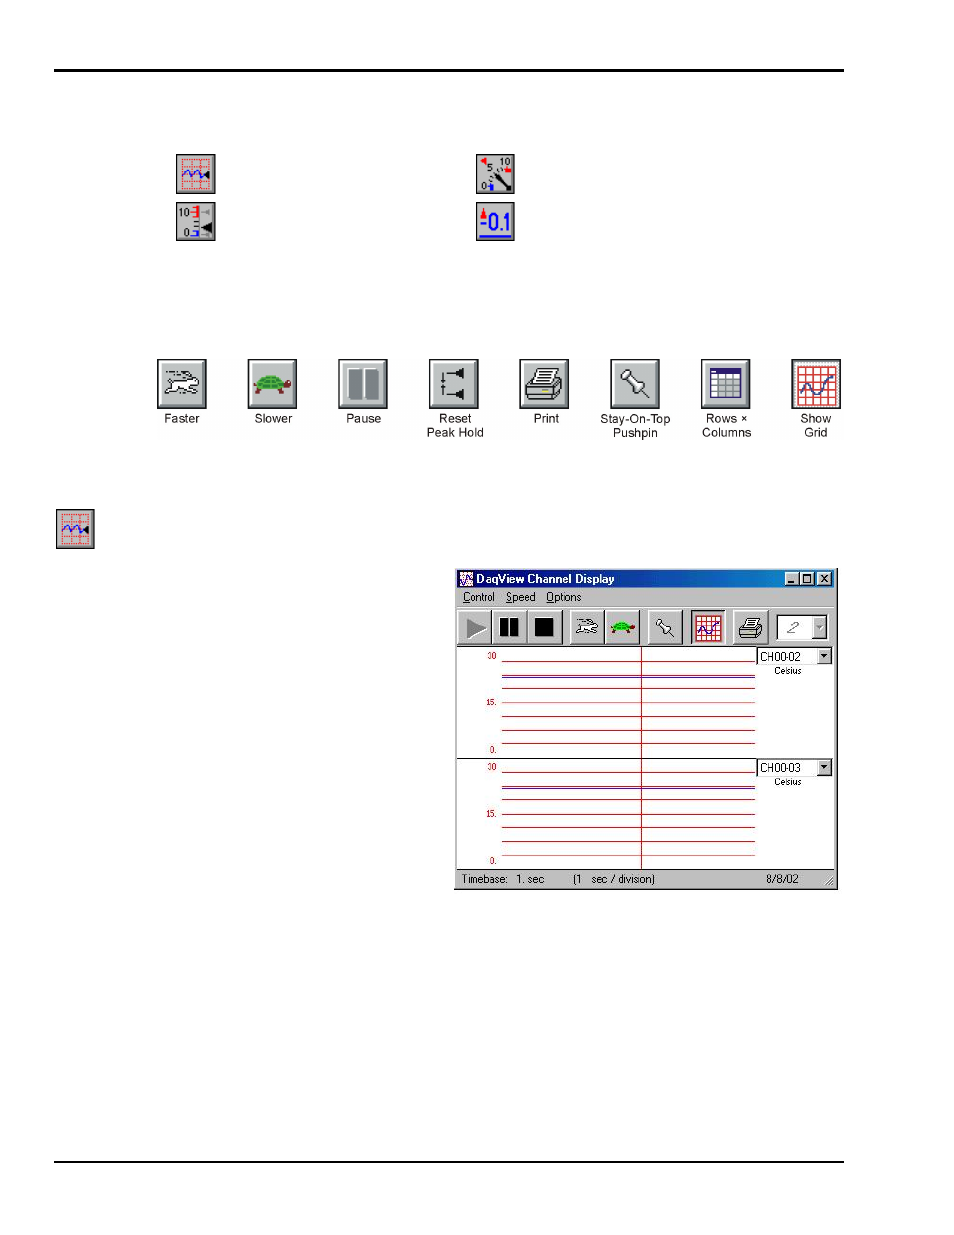
Charts
Charts displays real-time data in a strip-
chart format for several channels on the
DaqView Channel Display window.
Charts are enabled by selecting the
triangular “Play” button on the top left (see
figure). Before “playing”, at least one
chart must be assigned to an active channel
through the drop-down list on the right side
of the chart. For the selected channel, you
can change the minimum and maximum
values as needed. This command can also
be enabled from the Window pull-down
menu.
Data is read and displayed in the charts,
meters, and Readings column as fast as the
computer will allow. When an acquisition
to disk has begun using the Acquire
command, the charts, meters, and the
Reading column take a lower priority,
updating only when there is time in the
acquisition-to-disk task. Thus, the data
seen in the charts may not be the same as
on the disk. As the scan rate is increased,
the acquisition-to-disk task will take up
more processor time and the charts will be
unable to keep up.
DaqView Display Charts