Measurement Computing DASYLab User Manual User Manual
Page 13
DASYLab
© National Instruments Ireland Resources Limited
|
1-3
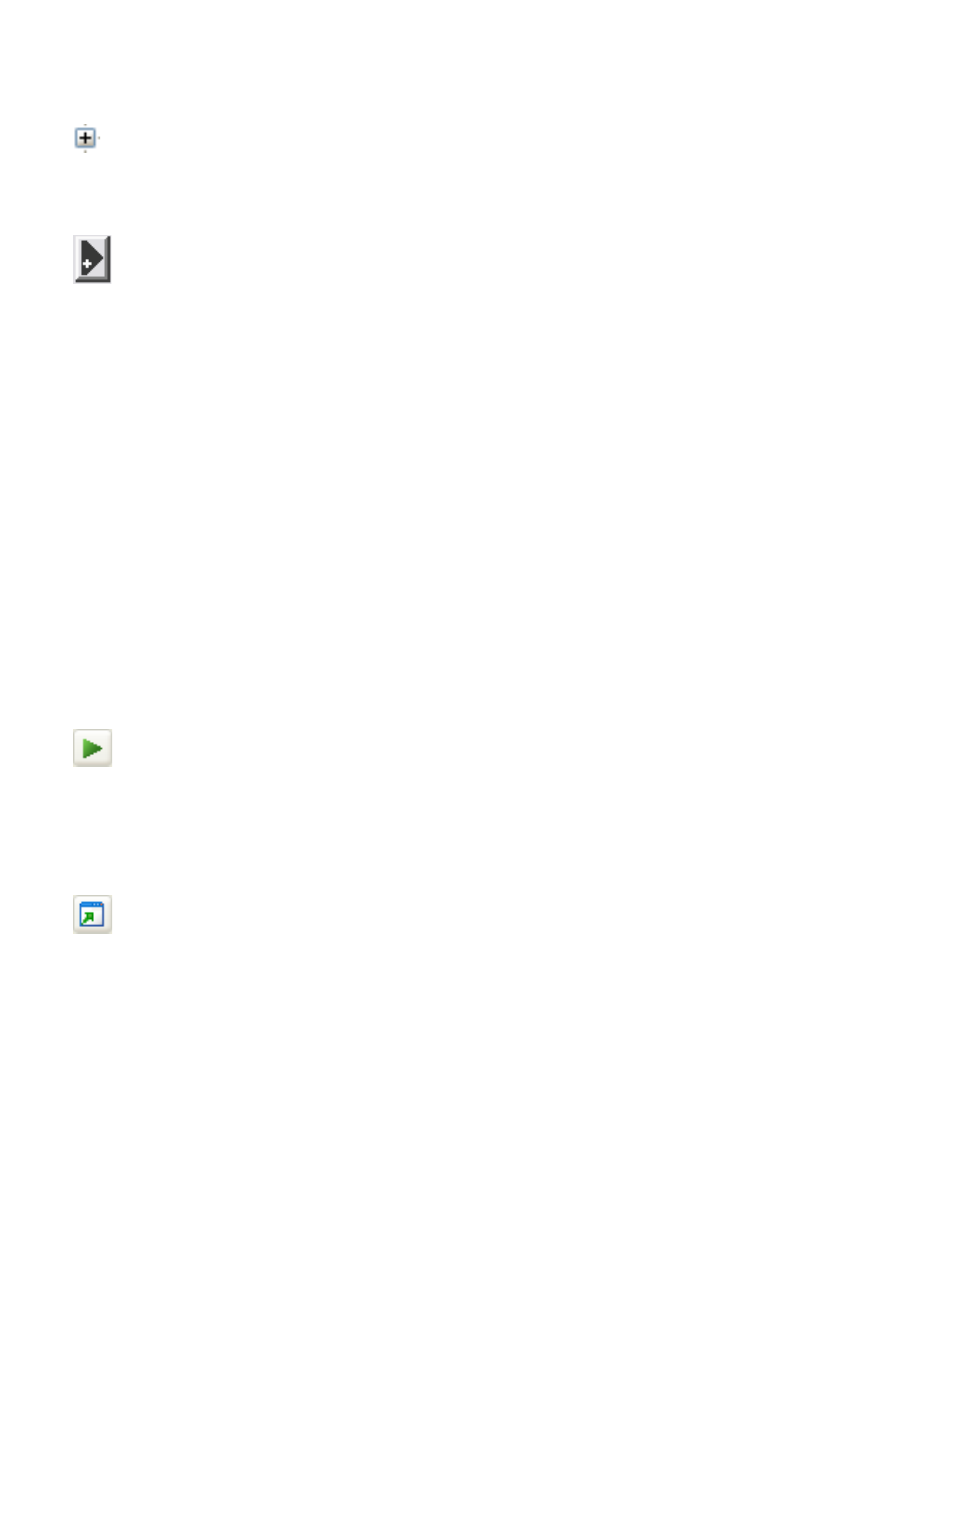
3.
Click the Plus sign next to the module group Display in the browser.
a.
Select the Y/t Chart module and drag and drop the module into the
worksheet.
b.
Double-click the Y/t Chart module to open the dialog box.
c.
Click the Plus button next to the channel bar to activate a second
input.
d.
Click OK. DASYLab adds another input to the Y/t Chart.
If you use display modules such as the Y/t Chart module, DASYLab
creates an additional display window which appears minimized at the
bottom of the screen.
You must connect the modules with data channels to let the data flow.
4.
To do so, click and hold the Y/t Chart module and drag the display
module to the Generator module until the chart inputs touch the
generator outputs.
When you release the mouse button, DASYLab automatically connects
the modules.
5.
Click Start on the function bar to start a measurement.
If you start a measurement and you want to see the display, you must open
the display window.
6.
Click Restore All Windows on the function bar. The Y/t Chart display
window opens and you can view the signals that the Generator module
generates, similar to Figure 1-2.