2 frequency response curves – Guralp Systems CMG-5TD User Manual
Page 30
Calibration
•
G is the acceleration output sensitivity (gain constant) of the
instrument. This relates the actual output to the desired input over the
flat portion of the frequency response.
•
A is a constant which is evaluated so that A × H (s) is dimensionless
and has a value of 1 over the flat portion of the frequency response. In
practice, it is possible to design a system transfer function with a very
wide-range flat frequency response.
The normalising constant A is calculated at a normalising frequency
value fm = 1 Hz, with s = j fm, where j = √–1.
•
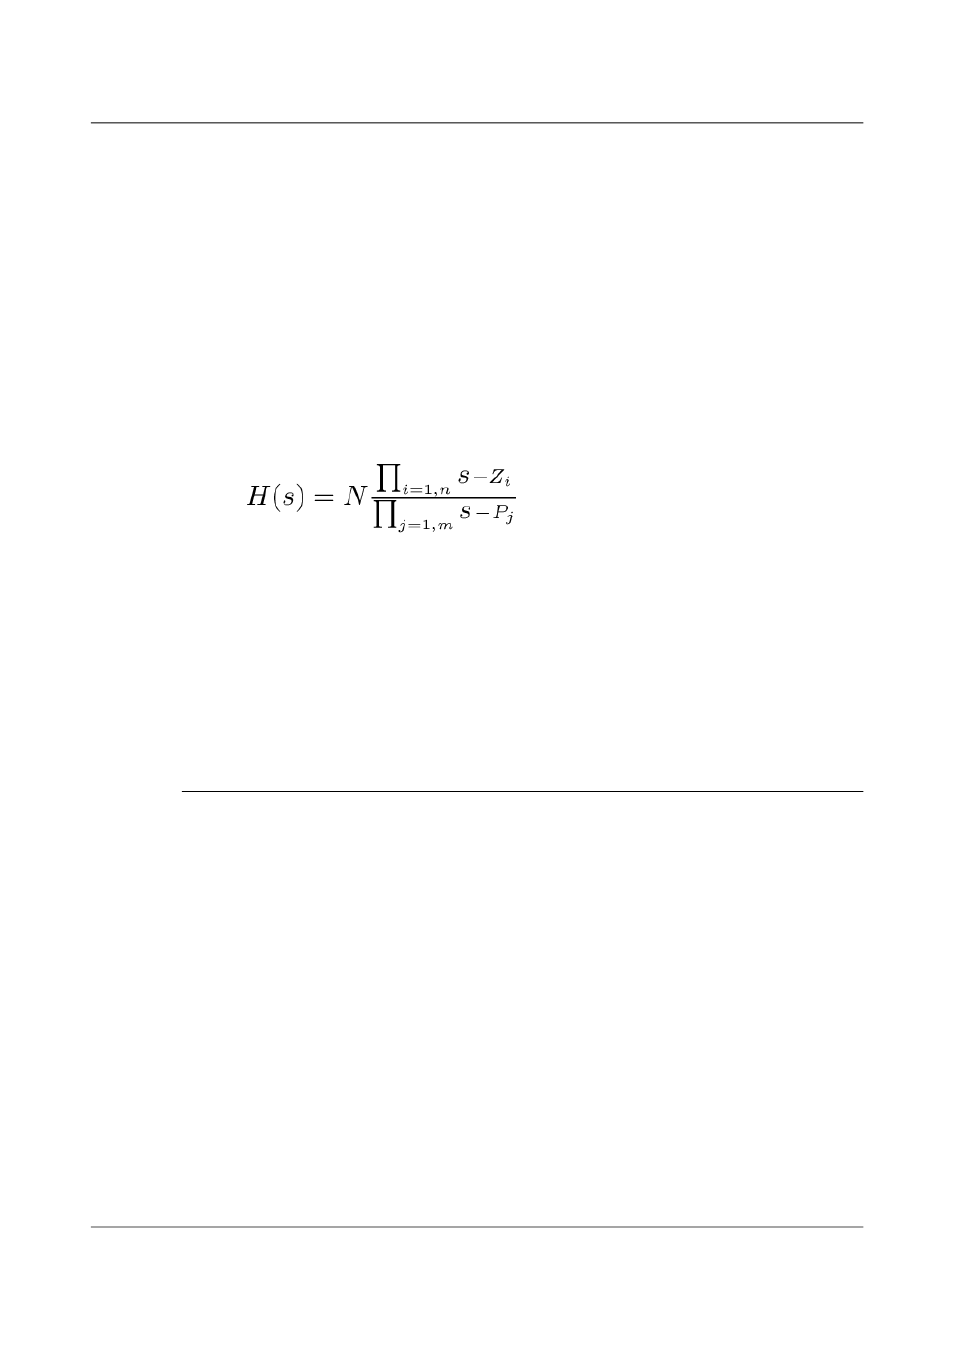
H (s) is the transfer function of the sensor, which can be expressed in
factored form:
In this equation, z
n
are the roots of the numerator polynomial, giving
the zeros of the transfer function, and p
m
are the roots of the
denominator polynomial giving the poles of the transfer function.
In the calibration pack, G is the sensitivity given on the first page, whilst the
roots z
n
and p
m
, together with the normalising factor A, are given in the Poles
and Zeros table. The poles and zeros given are measured directly at Güralp
Systems' factory using a spectrum analyser.
6.1.2 Frequency response curves
The frequency response of the CG-5TD is described in the normalised
amplitude and phase plots provided. The response is measured at low and
high frequencies in two separate experiments. Each plot marks the
low-frequency and high-frequency cut-off values (also known as –3 dB or
half-power points).
30
Issue D - April 2013