Occupancy graph – Comtech EF Data MIDAS 4 System and Design User Manual
Page 88

System and Design Manual, Revision 2
5–18 Operator
Functions
O
O
c
c
c
c
u
u
p
p
a
a
n
n
c
c
y
y
G
G
r
r
a
a
p
p
h
h
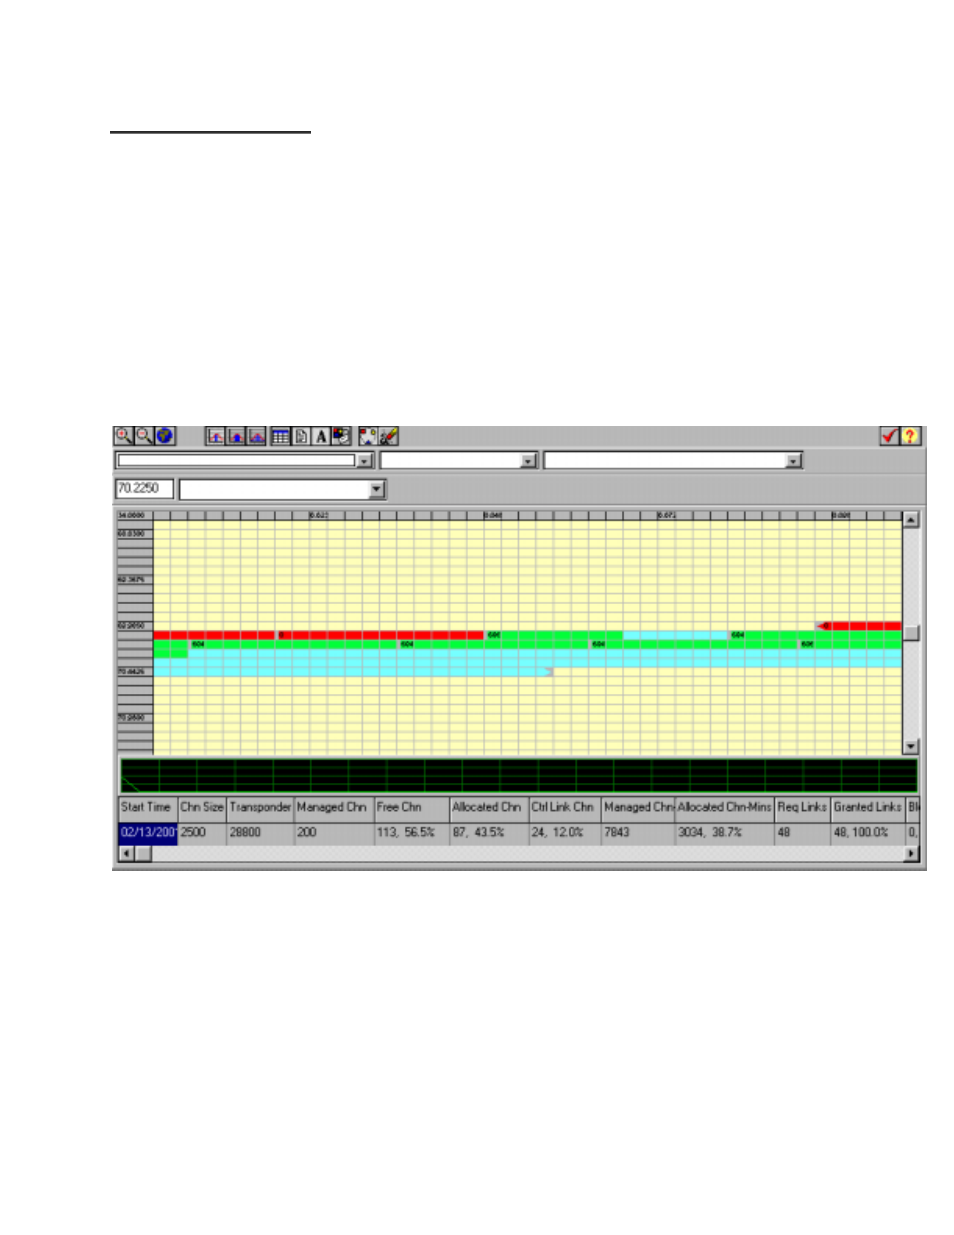
The Occupancy Graph is a color-coded graphical representation of the current
status of the owned bandwidth showing both free and allocated bandwidth.
The frequency blocks, corresponding to the minimum allocation granularity,
are displayed as squares on the graph that “wrap around” from left to right.
Different colors are used to indicate the state of each of the frequency blocks,
i.e. owned, free, control channel or active circuit. The users have the option of
displaying the frequency blocks allocated to active circuits color-coded by
data rate or the circuit type, i.e. data or Video. The graph is automatically
updated every 10 seconds.
Figure 5-16 illustrates a sample Occupancy Graph screen.
Figure 5-16. Occupancy Graph
The occupancy graph provides statistics for the owned bandwidth and can be
viewed on a pool basis.
Color-coding is used with text messages as follows:
