1 power measurement, Chart color setting, Power measurement – Xtramus NuOutlet-LN V1.1 User Manual
Page 32: 3 chart color setting
32
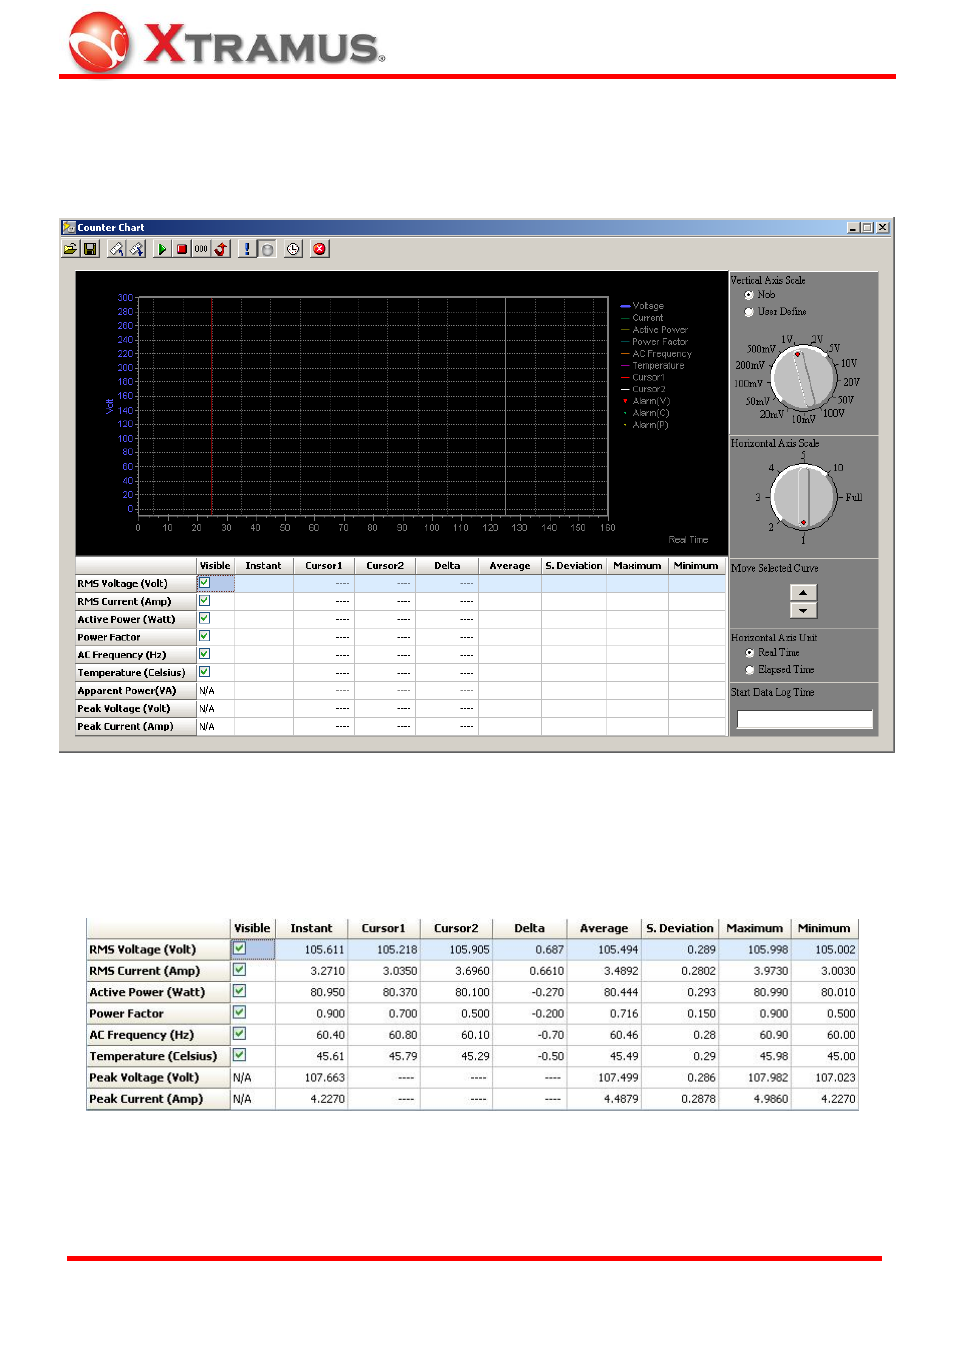
7.3 Chart Color Setting
The counter chart is configurable so that its appearance and functionality can be altered for
individual preferences.
7.3.1 Power
Measurement
By checking the Visible box next to the measurement description, the information shown in the
chart can be decided.
The chart above is divided into 8 fields (Instant, Cursor 1, Cursor 2, Delta, Average, S. Deviation,
Maximum and Minimum). These fields provide information on the values of the measurement:
Instant – The value at the last time point measured.
E-mail: [email protected]
Website: www.Xtramus.com
XTRAMUS TECHNOLOGIES
®