Pengo RevTrak User Manual
Page 25
PENGO RevTrak Manual 25
REvTRAK DATA ChARTING
0
000
2000
3000
4000
5000
6000
7000
8000
9000
0000
9:
44
:34:
004
9:
44
:49:
578
9:
45
:05:
57
9:
45
:2:
887
9:
45
:38:
504
9:
48
:33:
240
9:
48
:49:
270
9:
49
:06:
458
9:
49
:22:
949
9:
49
:39:
530
9:
52
:46:
306
9:
53
:03:
39
9:
53
:8:
887
9:
53
:35:
087
9:
53
:5:
293
Time
Torque / PSI
DIF PSI
Torque
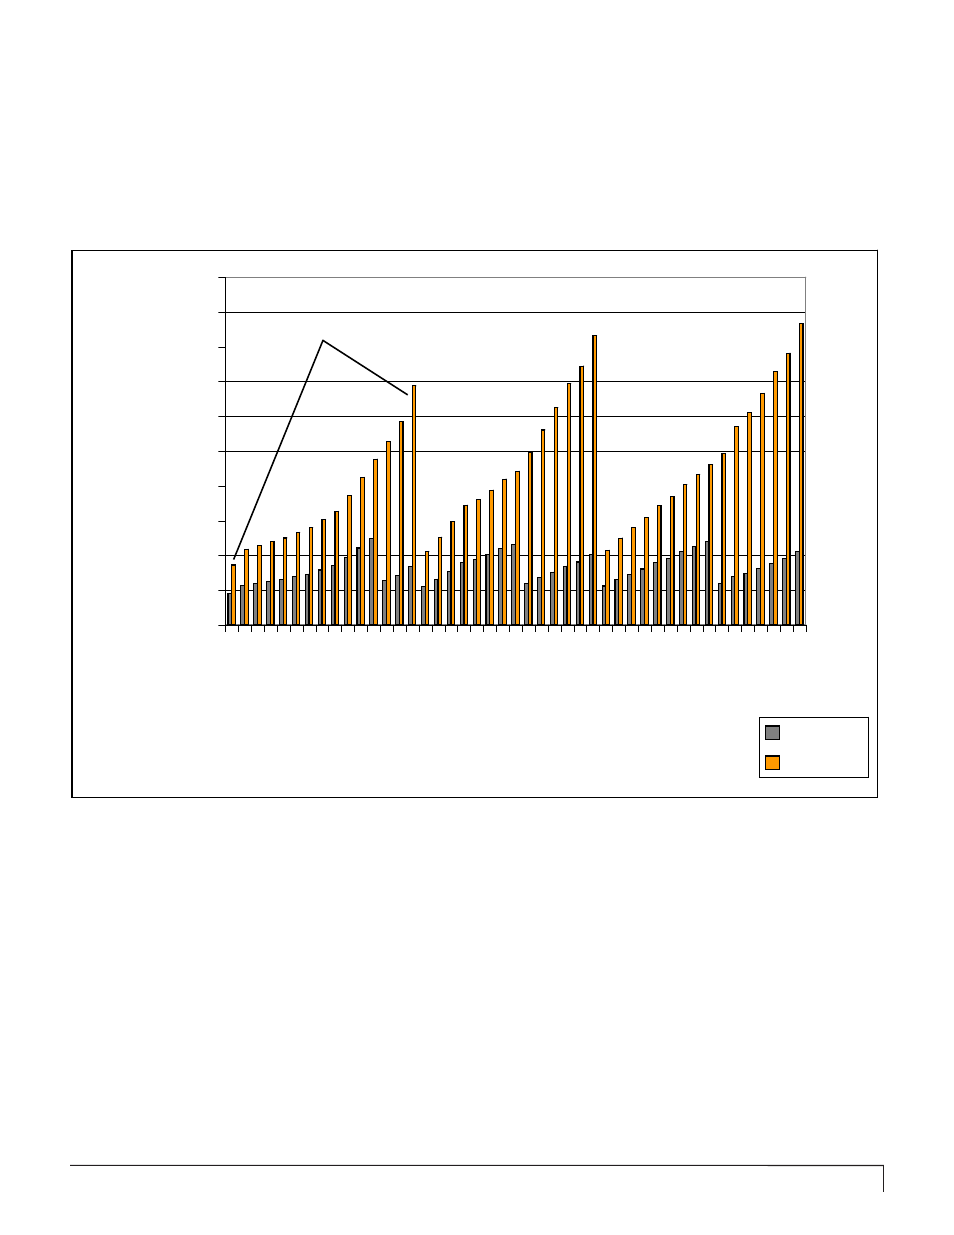
DATA ChARTING (CUSTOMIZED BAR ChART FORMAT)
Below is an example of the raw data customized in Microsoft Excel to display in bar chart format. In bar chart format
the individual pier installations is clear by the rise and fall of the torque / pressure. In this example the
DIF PSI, Torque
and
Time data columns were selected to create the bar chart.
Note: All torque values are recorded in FT/LBS
A bar chart format clearly illustrates torque
progression from start to stop.