Graph overview, A. graph control, B. graph data – SurgeX SX-DS-156 User Manual
Page 18
User Manual
Software Version 2.7
© 2013 SurgeX / Electronic Systems Protection, Inc. / Technical Support: 1-800-645-9721 / surgex.com Page 17
8. Graph Overview
a. Graph Control
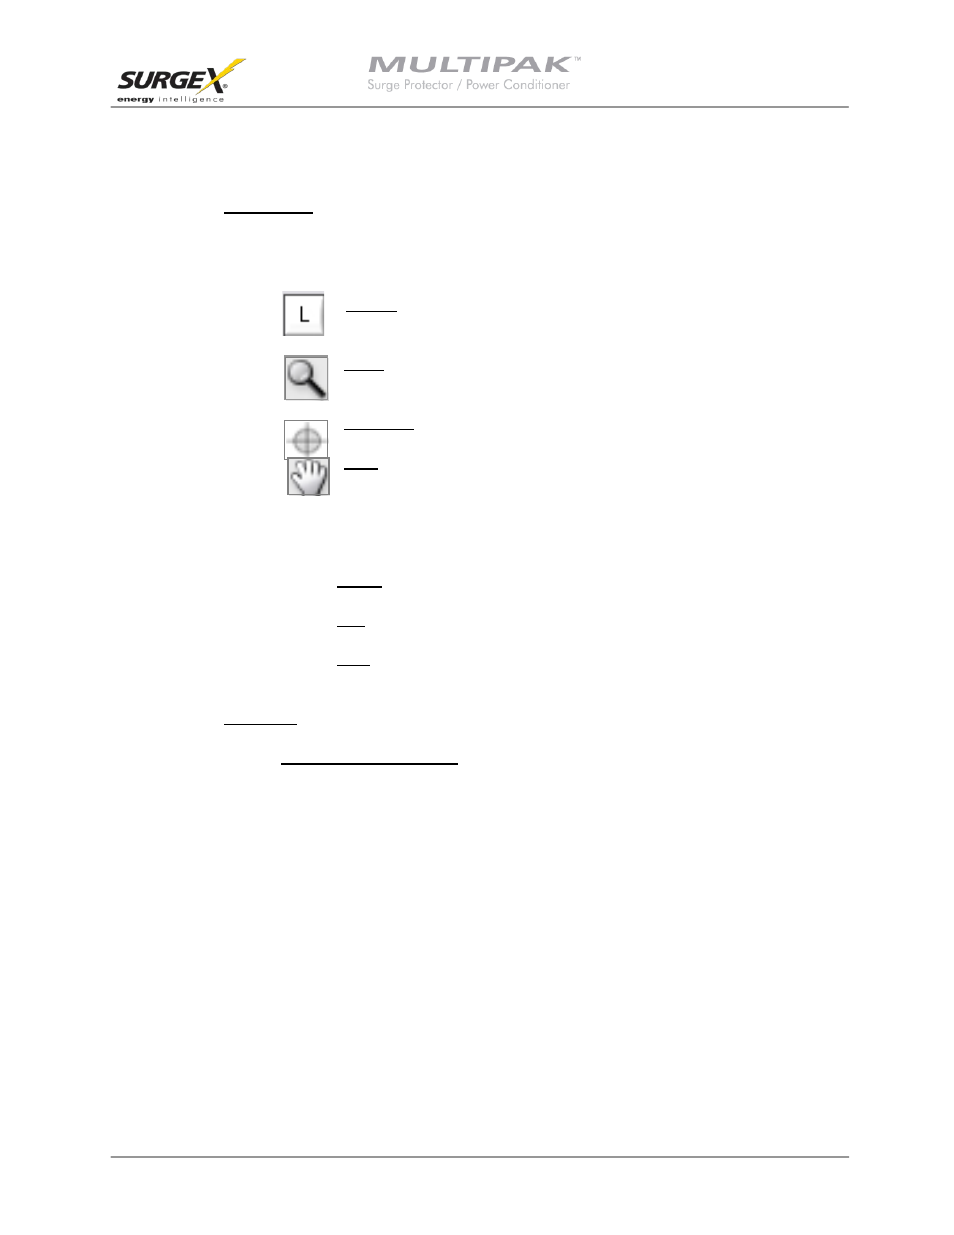
i. The graphs used to display the recorded power quality events (normal mode) and line
voltage (Enhanced Logging Mode) contain Zoom, Cross Hair, and Drag functions that are
useful when analyzing data:
Legend: Press the L icon to display the Graph Legend to show the values of the
timestamped data. Pressing the icon again toggles the legend off.
Zoom: Press the magnifying glass icon to enable Zoom mode. Pressing the icon
again stops Zoom mode and restores the graph to its full display scale.
Cross Hair: Turns the cross hair on and off.
Drag: Enables/Disables Drag mode. When in Drag mode, press and hold the left
mouse button somewhere on the graph, and move the mouse. The graph will be
dragged in the corresponding direction.
ii. Several control buttons are available below the graphs, depending on which mode is
active:
1. G1/G2: Toggles between Graph 1 (recorded power quality events) and Graph 2
(line voltage). Available after entering Enhanced Logging Mode.
2. **/--: Toggles the data display of Graph 2 (line voltage) between linear and
discrete data points. Available when Graph 2 is visible.
3. Stop: Stops Enhanced Logging Mode. Available after entering Enhanced Logging
Mode.
b. Graph Data
i. Power Quality Events Graph
1. Overview
a. The recorded power quality events graph displays the time-stamped
power quality events (up to 60) recorded and stored in the MULTIPAK’s
internal memory. The events are plotted as individual data points.
b. While the events are timestamped in the MULTIPAK’s internal memory
by the elapsed time since the previous recorded event, they are plotted
on the graph with an estimated date and time, based on the connected
computer’s Windows system time. The duration of a power outage is not
recorded, so the date and time of events prior to and including the most
recent power outage may not be accurate. Events with an accurate
estimated date and time are plotted with a red circle; events with a
possibly inaccurate date and time are plotted with a black circle; the time
the computer was connected is plotted with a blue square.
c. All events recorded while a computer is connected to the MULTIPAK will
have an accurate date and time stamp, since the computer will supply