2 view – YSI PC6000 User Manual
Page 22
PC6000 Menus
Section 4
YSI Incorporated
PC6000 Software Operations Manual
18
Once you copy data into the manual scaling column, it can be modified. After copying is
complete, you will lose “manual limits” that were defined previously.
!
You can not change Default Scaling limits.
!
You can change Manual Scaling limits.
!
You can not change Automatic Scaling limits, but they are updated each time an automatically
scaled plot is generated.
4.1.2
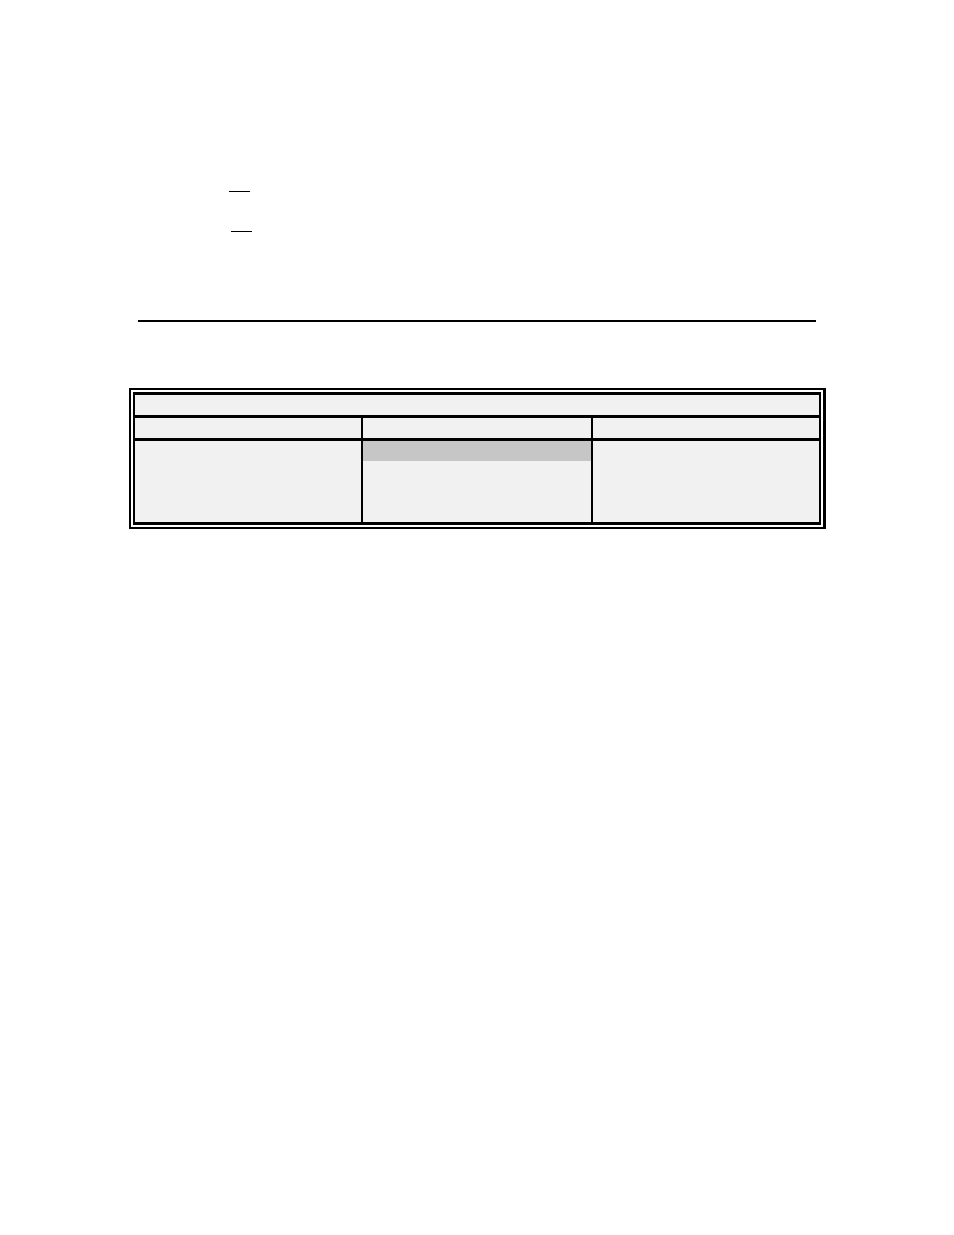
VIEW
All of the VIEW file options allow you to view file data on the screen.
Filename: SAMPLE.DAT
MODIFY
VIEW
SYSTEM
Parameters...
Header
Print Report
Control Info...
Report
Print Plot
Scaling Info...
Plot
Definitions...
Statistics
Export
Select Header to display complete information about the sonde, probes, and configuration of the
current file.
Select Report to display a complete list of all readings (as defined by the settings in the Modify
portion of the menu) from the current file to the screen. As the report is scrolled onto the screen,
you can pause at any time by pressing any key. Once the entire report has been displayed, use the
Arrow keys, the Page Up and Page Down keys, or the Home and End keys to move to any location
within the report. If your computer system has limited RAM, early data points within a report may
become unavailable for viewing. To redisplay unavailable data points, simply redisplay the Report
from the beginning.
Select Plot to display a plot of the current data file to the screen. The plot can be customized, see
Parameters and Control Info above. A plot can be abandoned at any time by pressing Esc, or
paused by striking any other key. If a plot is too large to fit on one screen, it will automatically
move to a new screen.
Select Statistics to view statistics of a data file, or portion of a data file. As with reports and plots,
the displayed statistics are affected by the choices you make in the Parameters, and the Control info
menus described previously. To view statistics for a portion of a file enter the start and stop times
in Control Info. Statistics are only available after a report or plot is run.