Q6sd-x60 charging graph - cooling, Cooling charging charts - 13 seer h.p. (continued), Q6sd series airflow data – Reznor Q6SD (3ph) Unit Installation Manual User Manual
Page 21
21
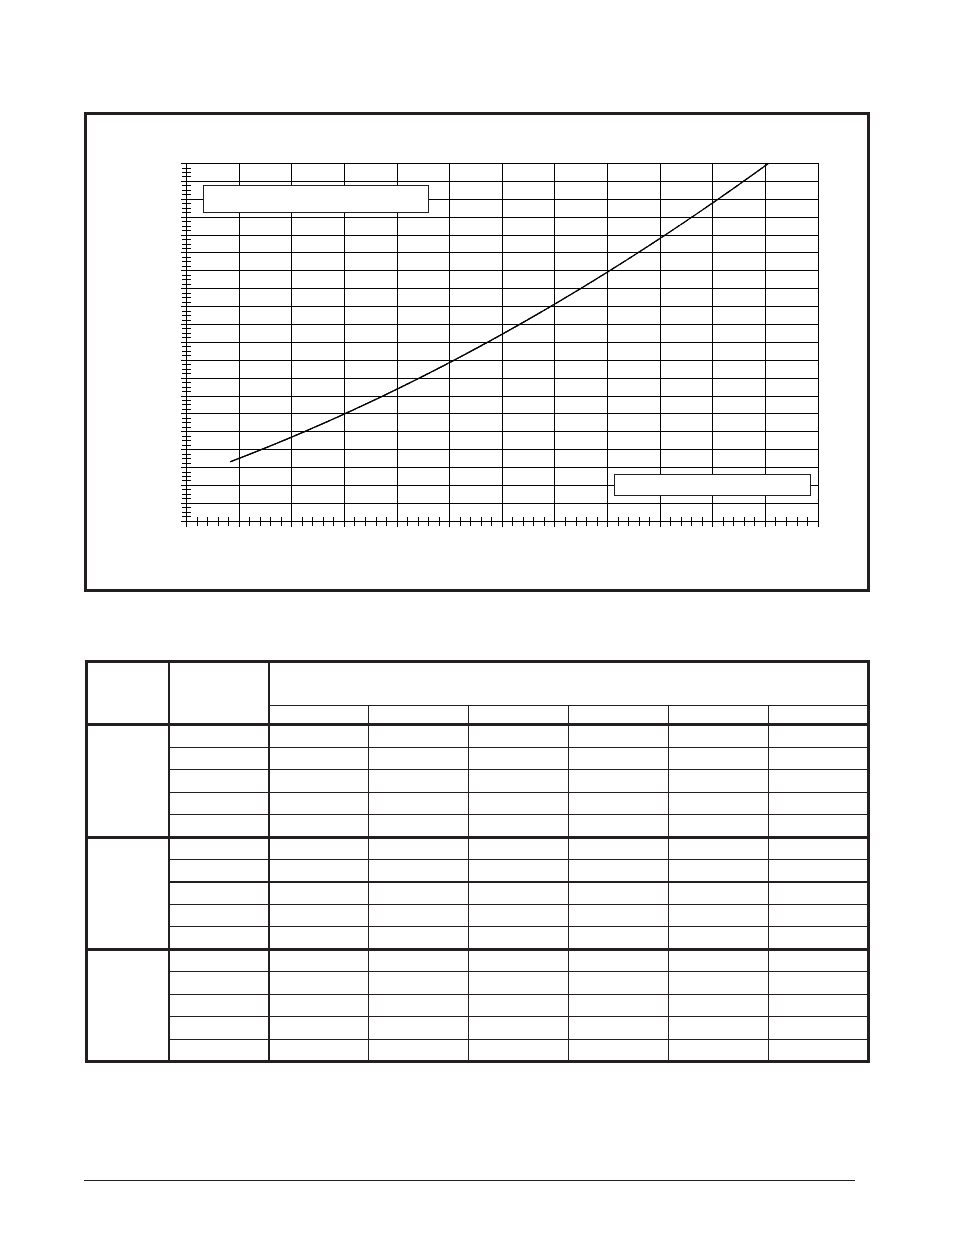
COOLING CHARGING CHARTS - 13 SEER H.P. (CONTINUED)
Q6SD-X60 Charging Graph - Cooling
200
220
240
260
280
300
320
340
360
380
400
420
440
460
480
500
520
540
560
580
600
75
80
85
90
95
100
105
110
115
120
125
130
135
Liquid Temperature (° F)
L
iq
u
id
Pressu
re (p
si
g
)
Add refrigerant when below curve
Remove refrigerant when above curve
Figure 14. Charging Chart for 5 Ton Units
Table 5. Blower Curves
Model number
Q6SD
Motor
Speed
Tap
External Static Pressure Drop
(inches Water Column)
0.1
0.2
0.3
0.4
0.5
0.6
X36
Tap T1 **
1150
1050
1000
950
850
780
Tap T2
1230
1190
1120
1080
1000
950
Tap T3 *
1464
1394
1332
1272
1216
1143
Tap T4
1600
1500
1400
1300
1200
1050
Tap T5
1700
1650
1600
1565
1530
1480
X48
Tap T1 *
1515
1450
1380
1350
1300
1250
Tap T2 **
1580
1520
1460
1400
1360
1300
Tap T3
1740
1690
1650
1600
1540
1500
Tap T4
1960
1910
1840
1820
1780
1740
Tap T5
2090
2050
2010
1975
1940
1900
X60
Tap T1
1515
1450
1380
1350
1300
1250
Tap T2 **
1580
1520
1460
1400
1360
1300
Tap T3 *
1740
1690
1650
1600
1540
1500
Tap T4
1960
1910
1840
1820
1780
1740
Tap T5
2090
2050
2010
1975
1940
1900
* Denotes factory set cooling speed
** Denotes factory set electric heating speed
NOTE: Airfl ow performance is with a dry coil
Q6SD SERIES AIRFLOW DATA
- UDAP Unit Installation Manual (40 pages)
- UDBP Unit Installation Manual (44 pages)
- UEAS Unit Installation Manual (44 pages)
- VPS Unit Installation Manual (44 pages)
- VPT Unit Installation Manual (40 pages)
- VCS Unit Installation Manual (48 pages)
- CAUA Unit Installation Manual (44 pages)
- EEDU Unit Installation Manual (32 pages)
- LDAP Unit Installation Manual (44 pages)
- MASA Unit Installation Manual (40 pages)
- RDF Unit Installation Manual (28 pages)
- RPB Unit Installation Manual (40 pages)
- SC Duct Furnace Unit Installation Manual (40 pages)
- SSCBL Unit Installation Manual (60 pages)
- X Unit Installation Manual (32 pages)
- ZQYRA Unit Installation Manual (72 pages)
- ADF Unit Installation Manual (28 pages)
- F Unit Installation Manual (40 pages)
- PDH (Indoor PreevA) Unit Installation Manual (72 pages)
- MAPSIII Unit Installation Manual (76 pages)
- RDH (Outdoor PreevA) Unit Installation Manual (68 pages)
- RP (Outdoor Duct Furnaces) Unit Installation Manual (32 pages)
- YDHA Unit Installation Manual (76 pages)
- OH Unit Installation Manual (28 pages)
- RBL (Cabinet Blower) Unit Installation Manual (12 pages)
- REC (Evaporative Cooling) Unit Installation Manual (12 pages)
- RIHN Unit Installation Manual (20 pages)
- UDAP Option - Installation - Power Venting (12 pages)
- UDAS Option - Installation - Separated Combustion Venting (16 pages)
- WS Unit Installation Manual (15 pages)
- EBHB Option - Installation - Thermostat Kit (2 pages)
- EFMA Unit Installation Manual (27 pages)
- EWHB Unit Installation Manual (9 pages)
- EXUB Unit Installation Manual (16 pages)
- XAWS Unit Installation Manual (12 pages)
- XAWU Unit Installation Manual (12 pages)
- XBWU Unit Installation Manual (12 pages)
- MAPS III Option - Installation - Energy Recovery Module Installation (12 pages)
- UDAP in sizes 30 through 125 Option - Installation - Ceiling Suspension Kit (2 pages)
- UEAS Option - Installation - Downturn Nozzles - V3 (4 pages)
- UDBP Option - Installation - Polytube Adapter Instructions (4 pages)
- UDBS Option - Installation - Vertical Louvers - V3 Series (2 pages)
- B Option - Installation - Blower/Filter Cabinet (4 pages)
- PDH with 1-stage gas control or 2-stage gas control Gas Conversion Kit Instructions (8 pages)
- VP series infrared heaters High altitude conversion instructions (12 pages)