Histogram plot in plot manager, Histogram plot – ChemoMetec NC-3000 User Manual
Page 39
991-3003 Rev. 1.0
August 2013
39
Remove Row: Removes this row from the Plot Manger, re-numbers subsequent rows and moves
the subsequent rows up.
Show Hidden Rows: Toggles between showing and hiding rows marked as hidden.
dialog for the file corresponding to the selected row.
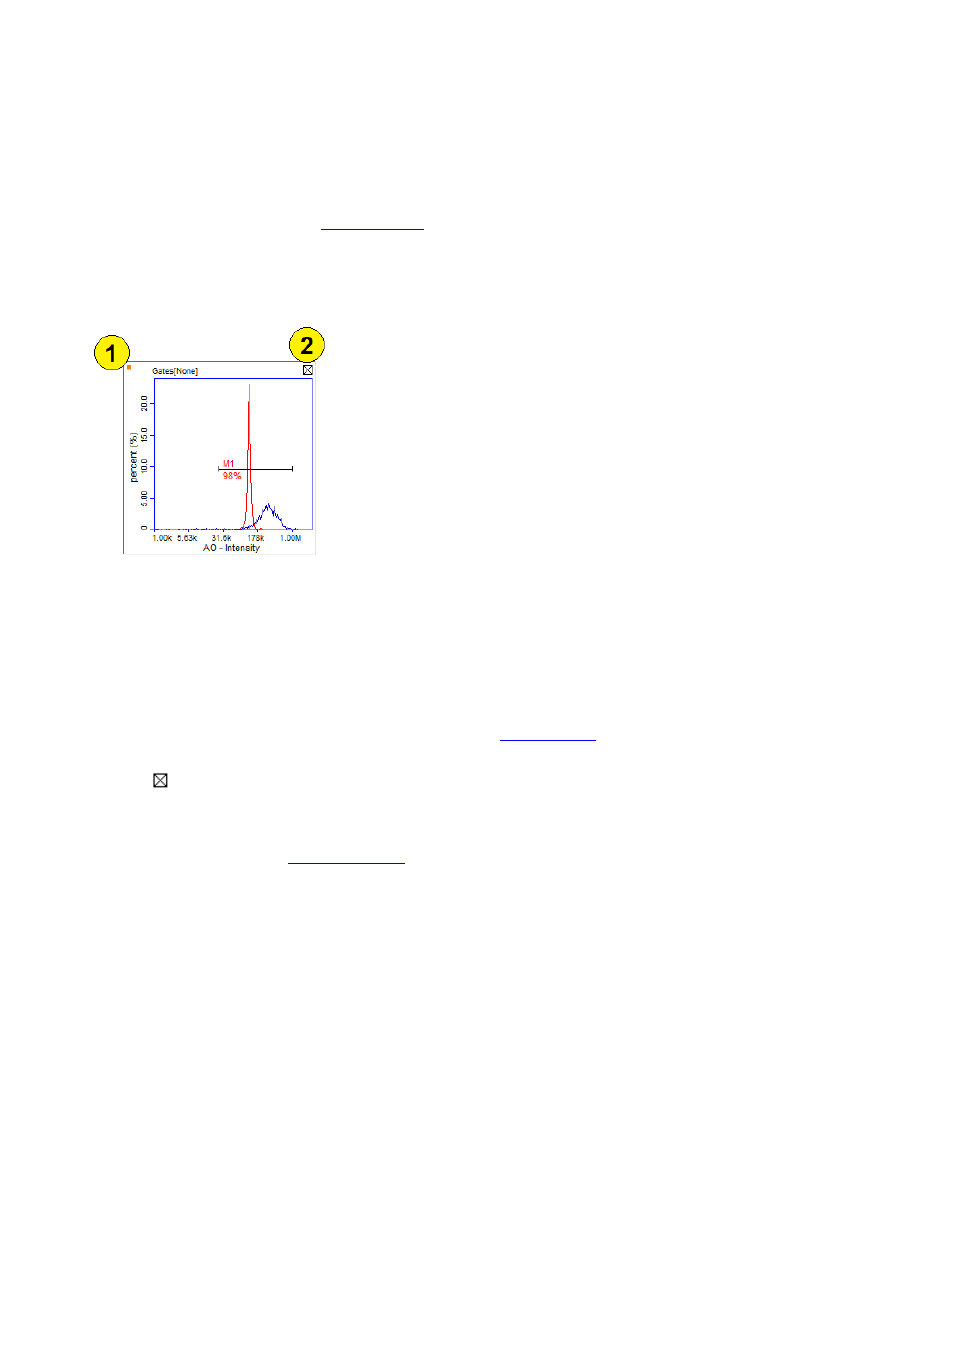
Histogram Plot in Plot Manager
The histogram plot is used to plot a user selectable parameter together with user defined marker sets
which marks, gates and counts cell populations.
The histogram above shows a histogram for the rows own cell population (red) plus an overlay with a
histogram from another row (blue).
1. Data source indicator: A small colored square in the upper left corner indicates the source of the
cell population (see further details in the section
2.
Click the ‘delete plot’ button to remove a plot from the row. This will leave an empty area in
which you may, via right-click, insert another plot or simply delete the area.
Double-click: To launch the
plot, double-click in the plot area. In the large histogram plot
you can define axis parameters, markers and gating settings.
Right-click: Shows the context menu offering the following options:
Show Large Plot (dbl-click)
Copy BMP to Clipboard
Copy Histogram
Paste Histogram
Copy Histogram and Paste Histogram options may be used to insert and overlay histograms from other
histogram plots.