Plot statistics, Row window in plot manager, Statistics – ChemoMetec NC-3000 User Manual
Page 37: Row window
991-3003 Rev. 1.0
August 2013
37
Plot Statistics
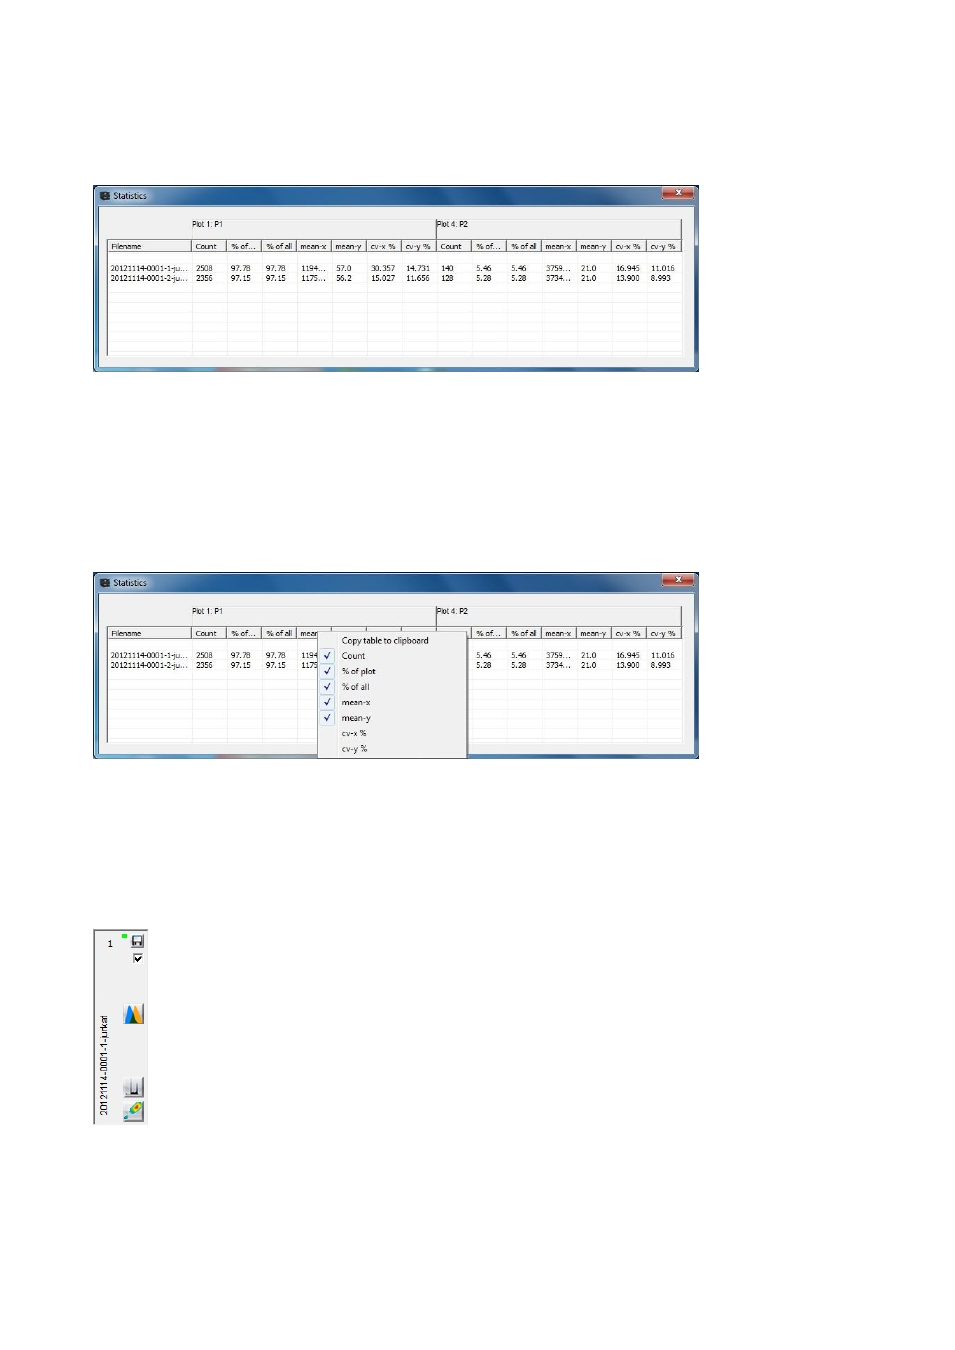
The Statistics window lists detailed gating statistics for all visible polygons and markers.
The above image shows all the available sub-columns. Right-click on a column header to edit which sub-
columns to display.
If several different alias names has been set for a gate the gate alias name presented in the statistics will be
for the first row with an alias name. Example: if P1 has been named ‘live cells’ in row 1 and ‘GFP’ in row 2,
then the statistics window will show ‘P1 live cells’.
Right-click in the table offers an option to copy table contents to clipboard which can be directly pasted
into a spreadsheet program.
Row Window in Plot Manager
The Plot Manager Row Window is used as row header for the post processing of a specific image file. It is
always placed in the left side of the Plot Manager window.