Plot manager, Plot, Manager – ChemoMetec NC-3000 User Manual
Page 35
991-3003 Rev. 1.0
August 2013
35
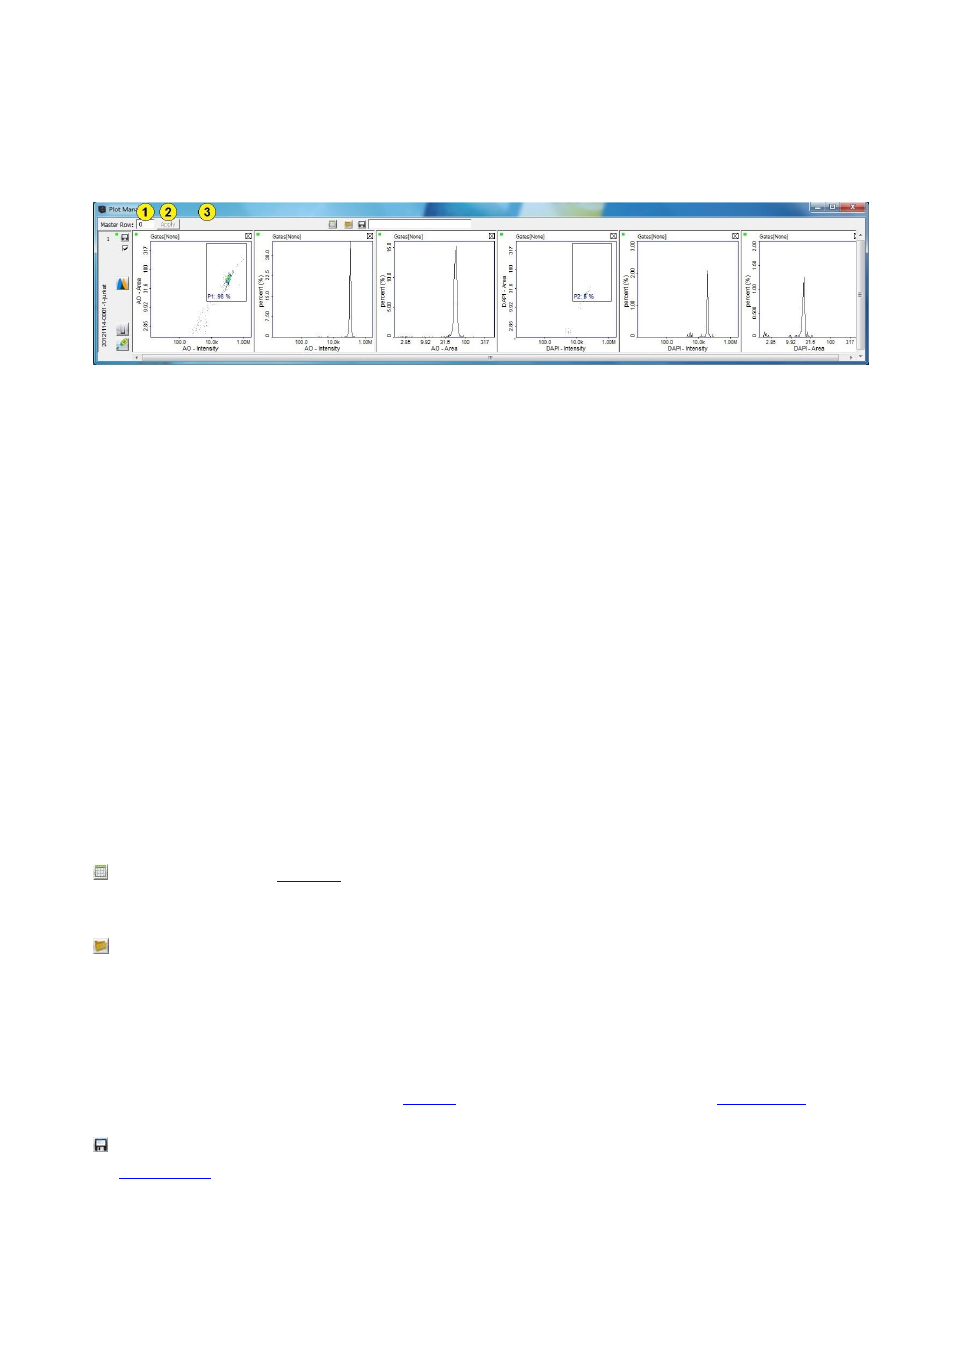
Plot Manager
The Plot Manager is used for evaluation and post processing of cell populations found in one or more image
files.
Results are displayed in scatter plots and histograms arranged in rows and columns, where each row
comprises results for one particular image file.
The Plot Manager is specifically suited for batch processing of several image files as it can replicate
processing from one ‘Master’ row to all selected rows.
1. Master Row: Enter the number of the row that is to be used as the Master row that functions like a
template.
2. Apply: This button replicates all processing from the Master row to all selected rows.
Note that a blank area will appear in target rows if the channel defined in the master row does not
exist in the file for the target row or if the parameter defined in the master row does not exist in
the file for the target row.
3. Info field: The area to the right of the ‘Apply’ button displays information regarding the plot
coordinates and number of cells where the pointer is located in the Plot Manager.
This button launches a
window which lists detailed gating statistics for all visible polygons and
markers.
This button launches a window to add Plot Manager files (*.cmpm) or post processing files (*.cmpp) to
the Plot Manager. Each added image file will be appended as one new row.
Two exceptions exist: Adding a *.cmpp file from the Master files directory or when a *.cmpm file holds a
master row. In these cases the file will be added to row number zero (i.e. as upper most row). In case row
zero already holds an image data file, the new file will be appended as one new row.
Note, it is also possible to load image files (*.cm) and processed plot manger files (*.cmpp) into the Plot
Manager by dragging them from either the
list in the main window or from the
There are two ‘save’ buttons in the Plot Manager. The ‘save’ button exists for each row and is placed in
in the left part of the row. This button saves the post processing data i.e. gates, polygon,
quadrants and graphs associated with the individual sample. The second type of ‘save’ button at the top of