BUCHI NIRWare User Manual
Page 39
NIRWare 1.5 Software Manual
Tutorial
33
Turn the sample vials and click on the green check mark icon to start the next measurement sequence.
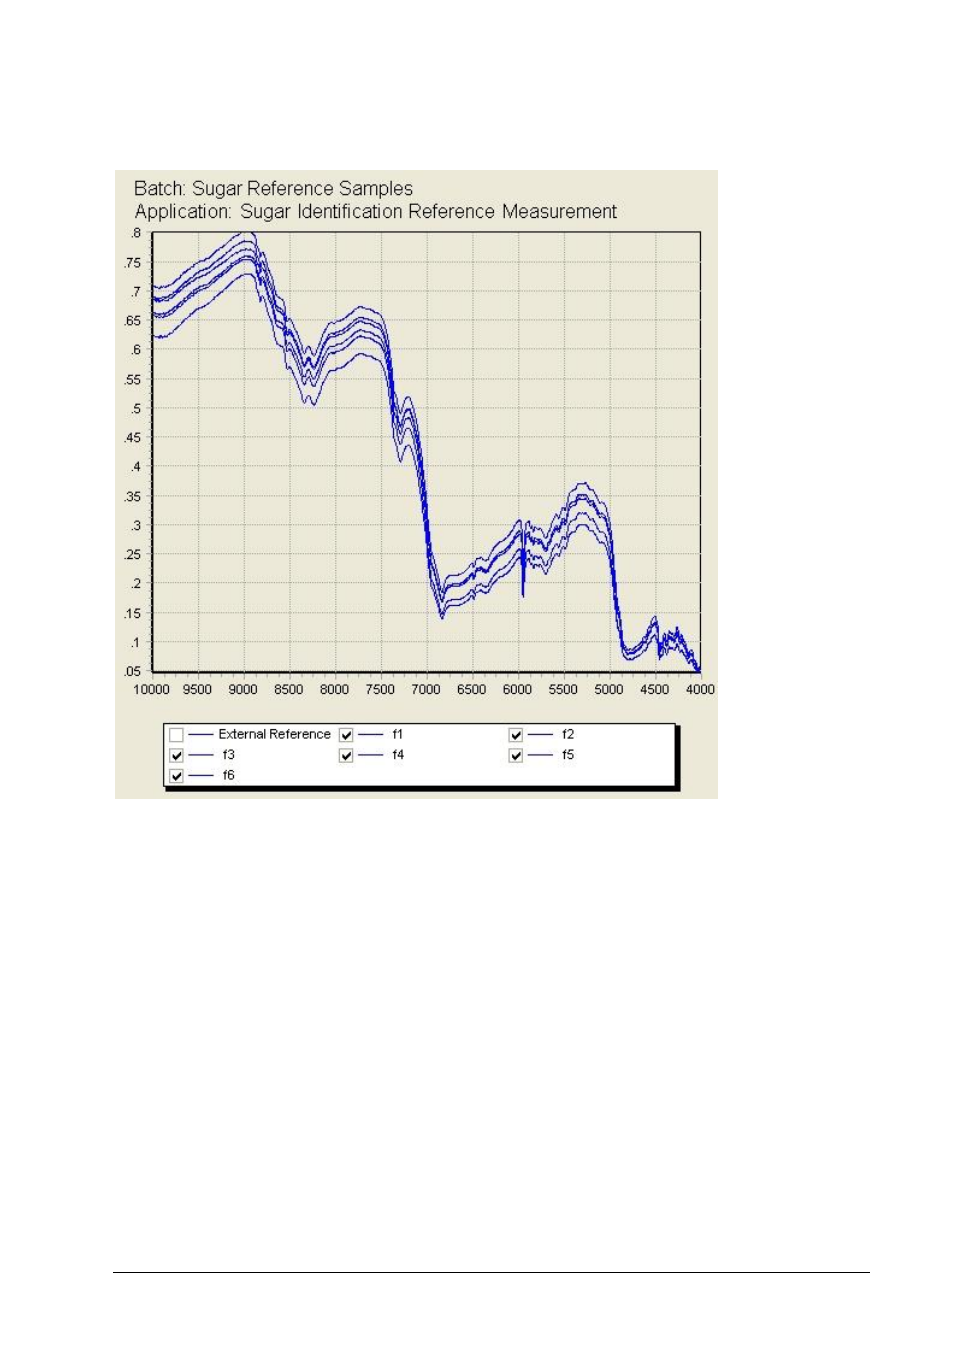
The spectra shown below are all from identical fructose samples.
The strong variations along the y-axis (shift) are typical for reflectance measurements of solids and result
from variations in particle size and
–orientation, and other sources of variation, e.g. thickness of the glass
vials.