0 load cell electrical theory, 1 wiring, 2 calibration data – Rice Lake Z6 Single-Ended Beam, SS Welded-seal, IP67, OIML C3 User Manual
Page 13: 3 output, Load cell electrical theory, 1 wiring 6.2 calibration data 6.3 output
Load Cell Electrical Theory
9
6.0
Load Cell Electrical Theory
6.1
Wiring
A load cell may have a cable with four or six wires. A six-wire
load cell, besides having + and - signal and + and - excitation
lines, also has + and - sense lines. These sense lines are
connected to the sense connections of the indicator. These
lines tell the indicator what the actual voltage is at the load
cell. Sometimes there is a voltage drop between the indicator
and load cell. The sense lines feed information back to the
indicator. The indicator either adjusts its voltage to make up
for the loss of voltage, or amplifies the return signal to
compensate for the loss of power to the cell.
Loa d c ell wires are color code d to help with proper
connections. The load cell calibration data sheet for each load
cell contains the color code information for that cell. Rice Lake
Weighing Systems also provides a load cell wiring color guide
on the back cover of our Load Cell Guide.
6.2
Calibration Data
Most load cells are furnished with a calibration data sheet or
calibration certificate. This sheet gives you pertinent data
about your load cell. The data sheet is matched to the load
cell by model number, serial number and capacity. Other
information found on a typical calibration data sheet is output
expressed in mV/V, excitation voltage, non-linearity,
hysteresis, zero balance, input resistance, output resistance,
temperature effect on both the output and zero balance,
insulation resistance and cable length. The wiring color code
is also included on the calibration data sheet.
6.3
Output
A load cell’s output is not only determined by the weight
applied, but also by the strength of the excitation voltage, and
its rated mV/V full scale output sensitivity. A typical full scale
output for a load cell is 3 millivolts/volt (mV/V). This means that
for each volt of excitation voltage applied at full scale there will
be 3 millivolts of signal output. If we have 100lbs applied to a
100lb load cell with 10 volts excitation applied the load cell
signal strength will be 30mV. That is 10V x 3 mV/V= 30 mV.
Now let’s apply only 50lbs to the cell, keeping our excitation
voltage at 10 volts. Since 50lbs is 50% or one half of full load,
the cell signal strength would be 15mV.
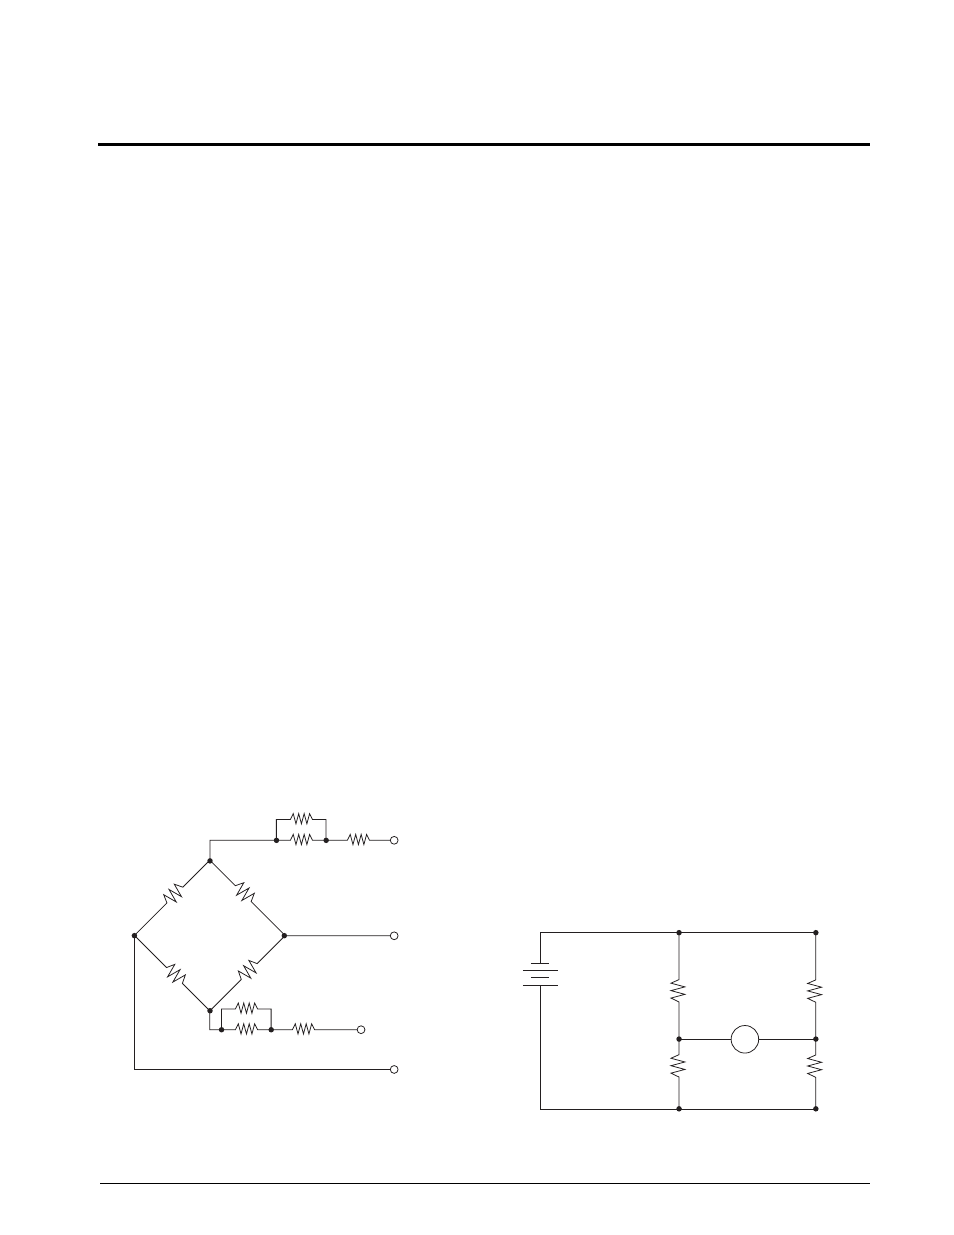
Figure 6-1. Wheatstone Bridge
The Wheatstone bridge shown in Figure 6-1 is a simple
diagram of a load cell. The resistors marked T
1
and T
2
represent strain gauges that are placed in tension when load
is applied to the cell. The resistors marked C
1
and C
2
represent strain gauges which are placed in compression
when load is applied.
The +In and -In leads are referred to as the +Excitation (+Exc)
and -Excitation (-Exc) leads. The power is applied to the load
cell from the weight indicator through these leads. The most
common excitation voltages are 10VDC, and 15VDC
depending on the indicator and load cells used. The +Out and
-Out leads are referred to as the +Signal (+Sig) and -Signal
(-Sig) leads. The signal obtained from the load cell is sent to
the signal inputs of the weight indicator to be processed and
represented as a weight value on the indicator’s digital display.
As weight is applied to the load cell, gauges C
1
and C
2
compress. The gauge wire becomes shorter and its diameter
increases. This decreases the resistances of C
1
and C
2
.
Simultaneously, gauges T
1
and T
2
are stretched. This
lengthens and decreases the diameter of T
1
and T
2
,
increasing their resistances. These changes in resistance
cause more current to flow through C
1
and C
2
and less
current to flow through T
1
and T
2
. Now a potential difference
is felt between the output or signal leads of the load cell.
Let’s trace the current flow through the load cell. Current is
supplied by the indicator through the -In lead. Current flows
from -In through C1 and through -Out to the indicator. From
the indicator current flows through the +Out lead, through C2
and back to the indicator at +In. In order to have a complete
circuit we needed to get current from the -In side of the power
s o u rc e ( I n d i c a t o r ) t o t h e + I n s i d e . Yo u c a n s e e w e
accomplished that. We also needed to pass current through
the indicator’s signal reading circuitry. We accomplished that
as the current passed from the -Out lead through the indicator
and back to the load cell through the +Out lead. Because of
the high internal impedance (resistance) of the indicator, very
little current flows between -Out and +Out.
Since there is a potential difference between the -In and +In
leads, there is still current flow from -In through T
2
and C
2
back to +In, and from -In through C
1
and T
1
back to +In. The
majority of current flow in the circuit is through these parallel
paths. Resistors are added in series with the input lines. These
resistors compensate the load cell for temperature, correct
zero and linearity.
Let’s look at a load cell bridge circuit in mathematical terms to
help you understand the bridge circuit in both a balanced and
unbalanced condition. Our Wheatstone bridge can either be
drawn in a conventional diamond shape or as shown in
Figure 6-2. Either way, it is the same circuit.
Figure 6-2. Wheatstone Bridge
58Ω
30Ω
10Ω
58Ω
30Ω
10Ω
-In (-Exc)
+Out (+Sig)
+In (+Exc)
-Out (-Sig)
T
2
350.5Ω
C
1
349.5Ω
T
1
350.5Ω
C
2
349.5Ω
V
-Exc
10V
+Exc
1
2
+Sig
-Sig
R
1
350Ω
R
3
350Ω
R
4
350Ω
R
2
350Ω
- UB6 S-Beam, SS, Hermetically-sealed, IP68, OIML C3 UB1/UB1 HE S-Beam, Stainless Steel TWM Tank Weighing Module THC Single-Ended Beam, Stainless Steel Tension Canisters Tedea-Huntleigh Single Points Tedea-Huntleigh Compression Canisters Tedea-Huntleigh T3P1 Tension Canister, Alloy Steel T2P1 Tension Canister, Alloy Steel STC, Low-Capacity, Alloy Steel STC SS S-Beam, Stainless Steel, IP67 STC S-Beam, Alloy Steel SSB Single-Ended Beam, Stainless Steel SQB-HSS Single-Ended Shear Beam, Stainless Steel SQB Single-Ended Shear Beam, Alloy Steel SP4 Single Point, Aluminum SLB Single-Ended Beam, Stainless Steel Single-Ended Beams Single Points SHB Single-Ended Beam, Stainless Steel Sensortronics Single Points Sensortronics Compression Canisters Sensortronics SEB Single-Ended Beam, Alloy Steel, OIML, IP67 S-Beam SB6 Single-Ended Beam, Stainless Steel, OIML C3 SB5 Single-Ended Beam, Stainless Steel SB4 Single-Ended Beam, Stainless Steel SB3 Single-Ended Beam, Alloy Steel SB14 Single-Ended Beam, Stainless Steel SB10 Single-Ended Beam, Stainless Steel S35 Universal, Stainless Steel RTM Stainless Steel Tank Weigh Module RSC S-Beam, SS NTEP 1:3000 Class III Single Cell RLSSB Single-Ended Beam, Stainless Steel RLSP4 Aluminum RLSCA-50K Rocker Column, Stainless Steel RLSBF Single-Ended Beam, Stainless Steel, IP67 RLSB2L/RLSB2M/RLSB2MLW Single-Ended Beam RLSB250/RLSB250T Single-Ended Beam, Stainless Steel RLSB2 Single-Ended Beam, Alloy Steel RLPWM16 Single-Point, Aluminum RLPWM15HE Single Point, Stainless Steel RLPWM15, Single Point, Stainles Steel RLPWM12 Single-Point, Aluminum RLPCBC-60 Stainless Steel RLPC6 Single-Point, Stainless Steel RLMK21 Single-Point, Stainless Steel RLMK1 Single-Point, Alloy Steel RLHTO Single-Ended Beam, Stainless Steel, OIML C3 RLHBB Single-Ended Beam, Stainless Steel RLH35 Single-Ended Beam, Stainless Steel RLETS S-Beam, Alloy Steel, IP67 RLETB Single-Ended Beam, Alloy Steel, OIML C3 RLDB50000S Double-Ended Beam, Stainless Steel RLCSP1 Compression Canister, Stainless Steel RLC Compression Canister, Stainless Steel RLBLP Planar Beam RLBLC Single-Ended Beam, Stainless Steel RL90000 Compression Disk, Alloy Steel RL8C2P1SS Compression Canister, Stainless Steel RL800WT Single-Point, Stainless Steel RL75223 Double-Ended Beam, Alloy Steel RL75114 Rocker Cell, Alloy Steel RL75060S Double-Ended Beam, Stainless Steel RL75058 Double-Ended Beam, Alloy Steel RL75040 Double-Ended Beam, Alloy Steel RL75016WHE Double-Ended Beam, Stainless Steel RL75016 SS Double-Ended Beam, Stainless Steel RL75016 Double-Ended Beam, Alloy Steel RL70000 SS Double-Ended Beam, Stainless Steel RL70000 Double-Ended Beam, Alloy Steel RL60040SST Single-Ended Beam, Stainless Steel, IP65 RL50210SS Single-Ended Beam, Stainless Steel, IP65 RL50210 Single-Ended Beam, Alloy Steel RL40BBS Single-Ended Beam, Alloy Steel RL39123 Single-Ended Beam, Stainless Steel RL35083 Single-Ended Beam, Stainless Steel RL35082 Single-Ended Beam, Stainless Steel RL35023S Single-Ended Beam, Stainless Steel RL35023 Single-Ended Beam, Alloy Steel RL30745 Single-Ended Beam, Stainless Steel RL30000 Single-Ended Beam, Alloy Steel RL2010 Tension Link, Stainless Steel RL20001 S-Beam, Alloy Steel RL20001 HE S-Beam, Stainless Steel RL20000 ST S-Beam, Stainless Steel RL20000 SS S-Beam, Stainless Steel RL20000 S-Beam, Alloy Steel RL1855HE Weigh Modules RL1521A Single-Point, Aluminum RL1385 Single-Point, Stainless Steel RL1380 Single-Point, Stainless Steel RL1260 Single-Point, Aluminum RL1250 Single-Point, Aluminum RL1140 Potted Single Point, Stainless Steel RL1042 Single-Point, Aluminum RL1040 Single-Point, Alumuinum RL1010 Single-Point, Aluminum S-Beams Compression Canisters Revere Transducers Single Point Revere Transducers S-Beams Revere Transducers Compression Canisters Revere Transducers Revere RC3 Rocker Cell, Stainless Steel RC1 Rocker Column, Stainless Steel PWS Single Point, Stainless Steel PW6K Single-Point, Aluminum, IP65 PW27 Single Point, Stainless Steel PW25 Single Point, Stainless Steel PW2 Single Point, Aluminum, IP65 PW16 Single Point, Aluminum PW15AH Single Point, Stainless Steel PW15 Single Point, Stainless Steel, IP67 PW12 Single Point, Aluminum PSD Compression Disk, Alloy Steel, OIML, C3 POD1 Weigh Module, Aluminum IP65 PCB Single Point, Stainless Steel, IP69 PC6 Single Point, Stainless Steel Hermetically-sealed, IP68 PC2 Single Point, Stainless Steel Hermetically-sealed, IP68 PC1 Single Point, Stainless Steel PB Planar Beam, Aluminum IP65 OIML Motor Truck Scale Electronic Conversion Kit Mettler Toledo DigiTOL Retrofit Kit MBB Single-Ended Beam, Alloy Steel LPS Single Point, Aluminum LOC Single Point, Aluminum LOC LE Single Point, Aluminum, Heavy Capacity Load Cells - Weigh Module LCD Compression Disk, Alloy Steel, IP67 JRT Torsion Ring Transducer, Alloy Steel/Stainless Steel Interface Compression Canisters HTC HSS S-Beam, Stainless Steel, Welded-seal, IP67 HPSM Single Point, Stainless Steel HPS Single Point, Stainless Steel, Welded-seal, IP67 HOC Single Point, Aluminum HBM Single Points HBM S-Beams HBM Compression Canisters HBM HBB Single-Ended Beam, Stainless Steel, Welded-seal, IP67 H35 Single-Ended Beam, Stainless Steel Flintec Single Points Flintec S-Beams Flintec Compression Canisters Flintec DSR-HSS Double-Ended Shear Beam SS, Welded-Seal, IP67 DSR Double-Ended Shear Beam, Alloy Steel, IP67 Double-Ended Beams DLB Double-Ended Beam, Alloy Steel CSP Compression Canister, Stainless Steel CSB Double-Ended Shear Beam, Alloy Steel CP Compression Canister, Stainless Steel, Welded-seal, IP68 CLB Double-Ended Beam, Alloy Steel Celtron Single Points Celtron S-Beams Celtron Compression Canisters Celtron Canisters C3P1 Compression Canister, Alloy Steel, IP67 C2P1 Compression Canister, Alloy Steel C16 Rocker Column Pin, Stainless Steel BSP S-Beam, Stainless Steel BLH Compression Canisters BLF Single-Ended Beam, Stainless Steel BLC Single-Ended Beam, Stainless Steel BK2 Single-Ended Beam, Stainless Steel BBS Single-Ended Beam, Alloy Steel B35 Single-Ended Beam, Stainless Steel A35 Single-Ended Beam 9803 Link Beam, Stainless Steel 9523 Single-Ended Beam, SS, Welded-seal, IP67 9423 Link Beam, Stainless Steel 9363 S-Beam, Stainless Steel 9323 Link Beam, Stainless Steel 9223 Link Beam, Stainless Steel 92 Compression Canister, Alloy Steel, Welded-seal, IP68 9123 Single-Ended Beam, Stainless Steel 9103 Double-Ended Beam, Stainless Steel 9102 Single-Ended Beam, Stainless Steel 9010 Single Point Fluid Damped Load Cell 792 Compression Canister, Stainless Steel, IP68 65114 Rocker Column, Stainless Steel 65083 Single-Ended Beam, Stainless Steel, Welded-seal, IP67 65083 S Single-Ended Beam, Stainless Steel 65061A Double-Ended Beam, Alloy/Stainless Steel 65059 Vishay Sensortronics 50-500 lb Capacities - Load Cell/Weigh Module Handbook 65059 Vishay Sensortronics 1000-2500 Capacity - Load Cell/Weigh Module Handbook 65059 Mild Steel Single Module (Includes Load Cell) - Load Cell/Weigh Module Handbook 65059 Mild Steel 4-Module Kit - Load Cell/Weigh Module Handbook 65059 Mild Steel 3-Module Kit - Load Cell/Weigh Module Handbook 65058 S Double-Ended Beam, Stainless Steel 65058 Double-ended Beam, Alloy Steel 65040A-1127W Double-Ended Beam, Alloy Steel 65040A Double-Ended Beam, Alloy Steel 65040 S Double-Ended Beam, Stainless Steel 65023A-5507 Single-Ended Shear Beam, Alloy Steel 65023A-5297 Single-Ended Shear Beam, Alloy Steel 65023A-5107-10 Single-Ended Shear Beam, Alloy Steel 65023A Single-Ended Shear Beam, Alloy Steel 65023 SS Single-Ended Beam, SS, Threaded and Thru, IP67 65023 S Single-Ended Shear Beam, Stainless Steel 65016WH Double-Ended Beam, SS Hermetically-sealed, IP68 65016W Double-Ended Beam, Stainless Steel, Welded-seal, IP67 65016 Double-Ended Beam, Alloy Steel, IP67 620 S-Beam, Stainless Steel, IP67 60063 S-Beam, Stainless Steel, IP67 60060 Single Point, Aluminum, Clear Anodized, IP67 60051 Single Point Beam, Stainless Steel, IP67 60050 S-Beam, Stainless Steel, IP67 60048 SS Single Point, Stainless Steel, IP67 60040 Single-Ended Beam, Alloy Steel, IP65 60001 S-Beam, Alloy Steel, IP67 5723 Link Beam, Alloy Steel 5223 Link Beam, Alloy Steel 5123 Single-Ended Beam, Alloy Steel 5103 Double-Ended Beam, Alloy Steel 5102 Single-Ended Beam, Alloy Steel, IP67 462 Single Point, Alloy Steel, IP67 363 S-Beam, Alloy Steel 355 Single-Ended Beam, Stainless Steel 3510-lbs Single-Ended Beam, Stainless Steel, IP68 3510-kg Single-Ended Beam, SS Welded-seal, IP68, OIML C3 3411/3421 Single-Ended Beam, Alloy & Stainless Steel 3200, Stainless Steel Compression Canister 240 Single Point Fluid Damped 220 Compression, Stainless Steel 1510 Single Point, Stainless Steel Welded-Seal, IP68 1320 Single Point, Aluminum 1260S Single Point, Aluminum 1260 Single Point, Aluminum 1250 Potted Single Point, Aluminum 1241 Single Point, Aluminum OIML C3 1240 Single Point, Stainless Steel 1200, Alloy Steel/Aluminum Compression Canister 1140 Potted Single Point, Stainless Steel 1130 Single Point, Stainless Steel 1042S Single Point, Aluminum 1042 Single Point, Aluminum 1040 Potted & Unpotted Single Point, Aluminum 1030 Single Point, Aluminum OIML C2.5 1022 Single Point, Aluminum 1010 Potted & Unpotted Single Point, Aluminum