Gossen GL SpectroSoft User Manual
Page 25
GOSSEN Foto- und Lichtmesstechnik GmbH
25
6.4
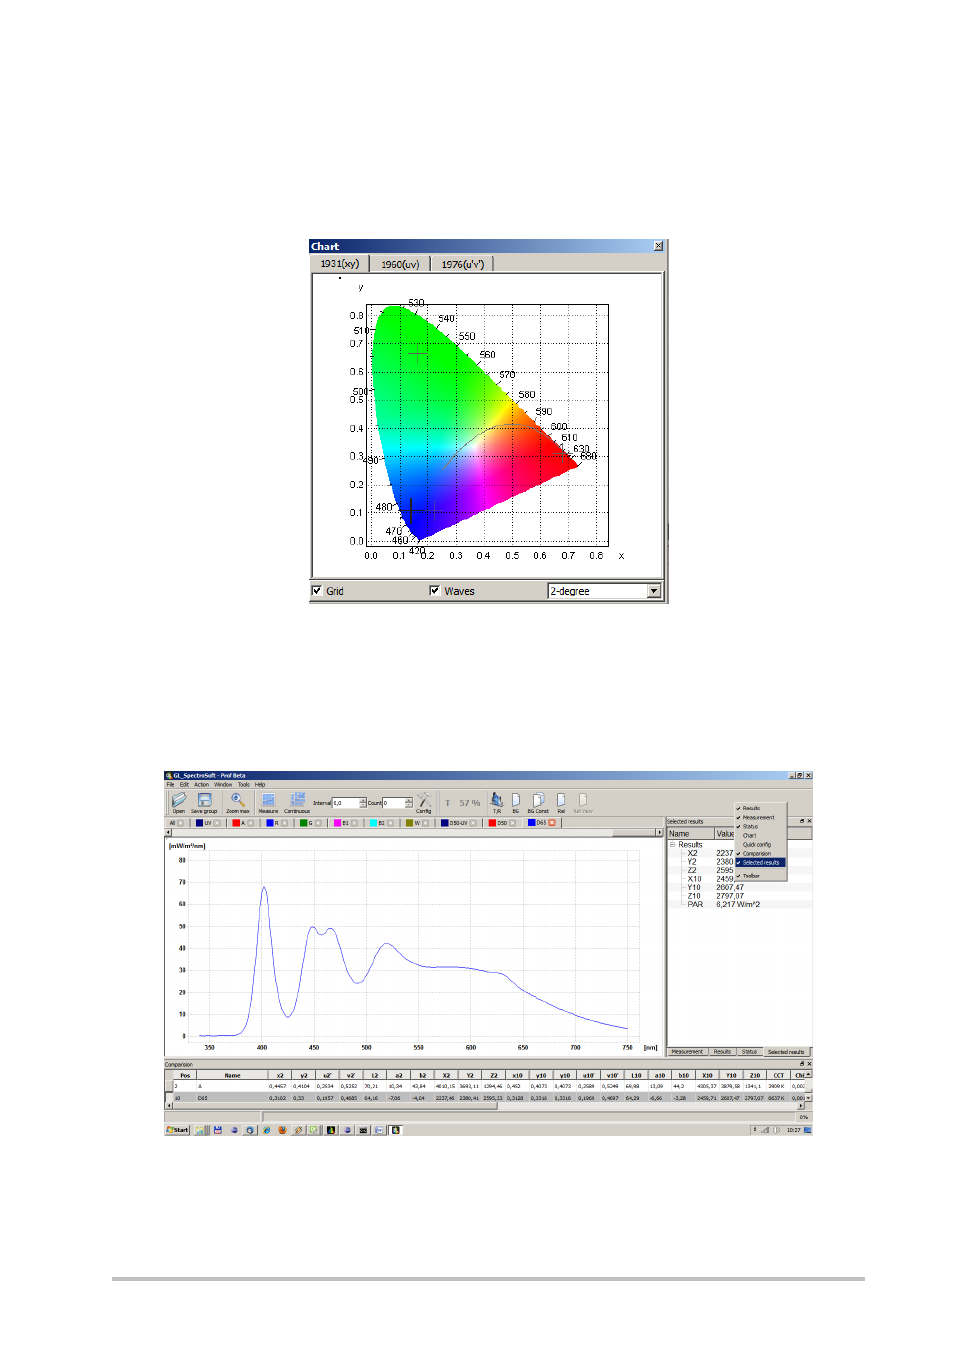
Chart
Chart window is a set of graphs representing chromacity diagrams determined by
the CIE. Bookmarks allow you to select a particular chart type.
6.5
Selected results
A very convenient perspective of results preview is selected results window. To make
this window visible right click on the tool bar and check "Selected results".
Now selected results window is visible and you can see a set of the most important
measurement parameters. To change a template set of a parameters or font, right click
on the selected results window - context menu appears.