Convergent beam sensing mode: model oasbcv, 6figure 5, Figure 4. excess gain curve – Banner OMNI-BEAM Series User Manual
Page 6: Figure 6. monitoring gradual dirt buildup
6
Figure 5.
DISTANCE
vs.
VOLTAGE
0
1
2
3
4
5
6
7
8
9
10
(dc volts)
0
6
12
18
24
30
36
Distance to 90% reflectance white test card (inches)
Inverting Output
D
B
C
A
CURVES:
A = min. NULL and min. SPAN
B = min. NULL and max. SPAN
C = max. NULL and min. SPAN
D = max. NULL and max. SPAN
Figure 4. Excess gain curve:
OASBD
1
.1
DISTANCE
10
100
.1 IN
1 IN
10 IN
100 IN
Range based on 90%
reflectance white test card
OASBD
E
X
C
E
S
S
G
A
I
N
I
4
2.7
.25
Max. NULL
Min. NULL
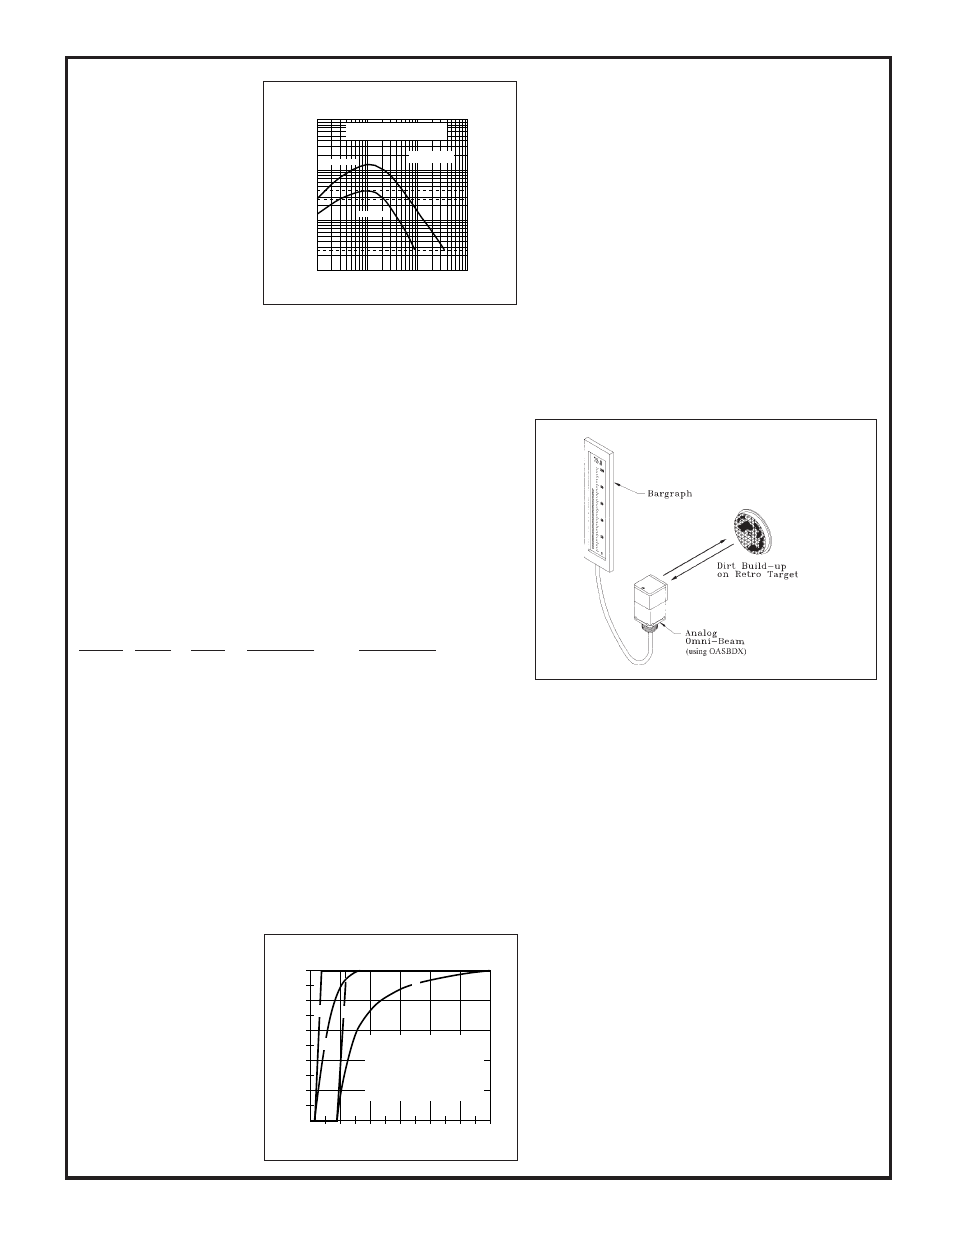
Figure 6.
Monitoring gradual dirt buildup
In applications where the mate-
rial being tracked is absorbent to
sound, analog photoelectric sen-
sor become the first choice.
Sound-abosrbent materials in
clude cloth fabrics, carpeting,
loose-fiber insultation, and open-
cell foam.
Excess gain curves may be used
to predict the general response of
diffuse mode analog sensors. Fig-
ure 4 is a plot of distance vs.
excess gain for sensor model
OASBD. The sensor's NULL
control is adjusted so that the
received signal at the maximum sensing distance produces an excess gain of 4X. This
is the point at which the inverted output first reaches zero volts, or at which the non-
inverted output just reaches 10 volts. When NULL is set for 4X excess gain, there is no
interaction between the NULL and SPAN adjustments.
From the plot of maximum NULL, the minimum distance (where excess gain is 4X) can
be as far as 5.5 inches from the sensor lens. The minimum distance can be as close as
.15 inch. However, from .15 inch outward, the excess gain increases until the target is
just over 1.0 inch away, and then decreases. Most applications require the excess gain
to constantly decrease with increasing target distance. It follows that a minimum NULL
setting will place the 4X excess gain point at about 1 inch (i.e. at the top of the curve).
Minimum SPAN required to produce a full 10 volt output swing represents an optical
contrast of 1.5:1 (i.e. a change in excess gain from 4X to 2.7X). Maximum SPAN
corresponds to a contrast ratio of 16:1 (i.e. a change from 4X to .25X).
From the excess gain plots for the OASBD, the sensing distances for the limits of
adjustment can be estimated:
Change in
Range of
Settings
NULL
SPAN
Excess Gain
Measurement
#1
MAX
MAX
4X to .25X
5.5 to 36 inches
#2
MAX
MIN
4X to 2.7X
5.5 to 7 inches
#3
MIN
MAX
4X to .25X
1 to 9 inches
#4
MIN
MIN
4X to 2.7X
1 to 2 inches
Sensor output voltage changes in proportion to change in excess gain. The excess gain
plots for the OSBD (Figure 4) appear fairly linear beyond the signal peak at 1 inch. This
is because the excess gain curve is plotted on a log scale. Excess gain decreases at an
exponential rate with increasing distance. Figure 5 illustrates how the output for model
OSBD would respond at the four extreme settings of the NULL and SPAN controls (as
listed in the table above). These plots are for the inverting output. Note that greater
linearity of response is possible over short distances (i.e. with lower SPAN settings).
It is important to keep in mind that the actual reflective properties of the material to be
sensed can have a dramatic effect on actual sensor response. The performance reference
for all diffuse mode sensors is a
Kodak 90% reflectance white test
card. Objects with lower
reflectivity will be "seen" over a
shorter range. Objects with sur-
faces that are specular (i.e. shiny
of mirror-like) can produce very
high excess gain when viewed
squarely at right angles by a dif-
fuse mode sensor, but produce
very low excess gain when viewed
at an angle only a few degrees off
of perpendicular. Also, the size
of the Kodak test card is 8x10
inches. Smaller objects may return
less ligh energy to the sensor.
In short, photoelectric analog distance measurement is dependent
upon too many variables to allow meaningful performance curves
to be published. Each Banner Analog OMNI-BEAM sensor head
has a specified maximum response distance. This is the distance to
a 90% reflectance white test card where the excess gain is .25X, and
assumes that the NULL ans SPAN controls are both set to maxi-
mum. It is always best to determine analog response empirically.
Whenever possible, sample materials should be sent to Banner's
Application Engineering Group via your local Banner Field Sales
Engineer. When necessary, your process may be avaluated on-site
by our Field Sales Engineer, using test sensors.
Analog OMNI-BEAM model OASBDX may be used with a
retroreflective target (such as model BRT-3) to monitor the gradual
accumulation of dirt, dust, frost, or other contaminants that attenuate
the passage of light (Figure 6). In practice, the retroreflective target
is mounted to a surface where the buildup is to be monitored. In some
applications, the target and sensor lens are both allowed to accumu-
late buildup. This same technique may be used to monitor density
levels of smoke or other airborne particles which flow between the
OASBDX and its retroreflector.
Convergent Beam Sensing Mode: model OASBCV
A convergent beam sensor uses a lens system that focuses the
emitted light to an exact point in front of the sensor, and focuses the
receiver element on the same point. This is a very efficient use of
reflective sensing energy. Most objects with small profiles can be
reliably sensed.
A convergent beam sensor will detect an object of a given reflectivity
at the sensor's focus point, plus and minus some distance. This
sensing area, centered on the focus point, is called the sensor's depth
of field. The size of the depth of field depends upon the reflectivity
of the object to be sensed. The excess gain curves for model
OASBCV (Figure 7) are plotted using a Kodak 90% reflectance
white test card.
Most of the analog distance measuring applications that use conver-
gent model OASBCV utilize half of the response curve. Distance
measurement usually begins at the focus (1.5 inches from the sensor
lens) and moves farther out, away from the sensor (Figure 8). It is
evicent from the excess gain curve that an analog convergent beam
sensor best monitors object displacements of less than .5 inch.
Much smaller displacements may be measured if the convergent
beam sensor can be located such that the edge of the object enters the
focus point from the side (Figure 9). In this type of application, the
reflectivity of the object and the angle of the object's surfce to the
sensor lens must remain constant.
Specular surfaces can "confuse" a convergent beam sensor. When
viwed straight-on, mirror-like reflections can cause a shiny surfce to