Rockwell Automation Arena Packaging Users Guide User Manual
Page 101
A
•
E
QUIPMENT
R
ELIABILITY
AND
L
OSS
95
•
•
•
• •
A •
R
eli
abi
lity
and Lo
ss
The first chart shows the output rate and good output rate of the machine over time if a
10% production loss is defined. Though the output rate of the machine is 100 units per
minute, the good output rate is only 90 units per minute because 10% of the product
produced by the machine is wastage. Of course, the machine produces nothing during the
failure from t
1
to t
2
.
The second chart shows the output rate and good output rate of the machine if, in addition
to a general 10% production loss, there are also units lost due to failures. At the end of the
failure at time t
2
, the machine immediately produces the quantity of Lost Units After
Failures. Then, the machine’s good output rate returns to 90 units per minute.
C
ONVEYOR
EXAMPLE
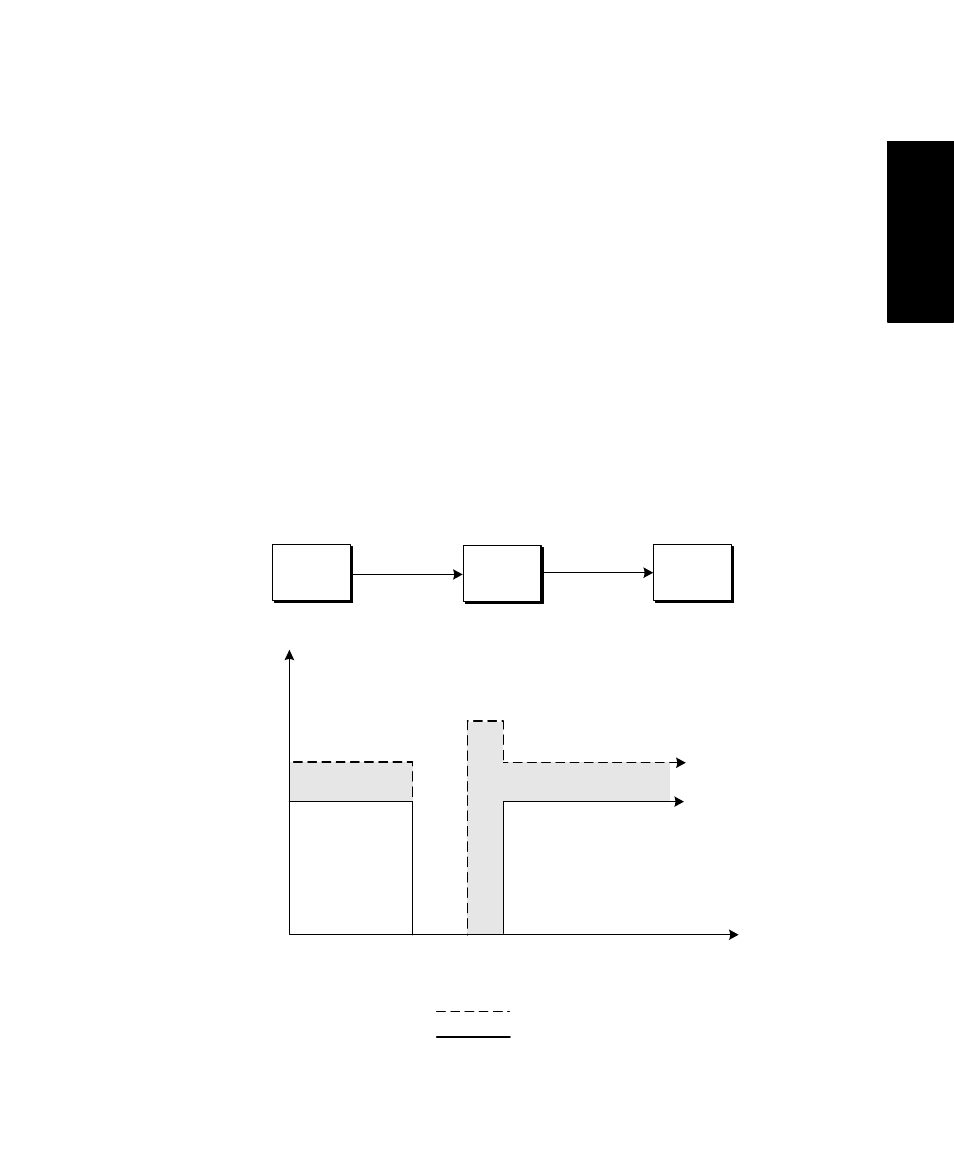
The chart below illustrates examples of both event- and production-based loss for an
accumulating conveyor. Suppose that the upstream basic machine is outputting good units
at a rate of 115 units per minute, the conveyor has a run speed (i.e., maximum transfer
rate) of 120 units per minute, and the downstream basic machine is running at 100 units
per minute. Suppose also that the conveyor has a 10% production loss, fails from time t
1
to
t
2
, and loses units when it fails.
Good Units
Lost Units
0
100
111
t
1
t
2
Good Units
Lost Units
Time
Rate
10% Production Loss & Lost Units After Failure
Total Output Rate of Conveyor
Good Output Rate of Conveyor
and Input Rate of Machine 2
Run Speed =
100 units/min
Basic
Machine 1
Basic
Machine 1
Conveyor
Conveyor
Basic
Machine 2
Basic
Machine 2
Run Speed = 120 units/min
Failure from t
1
to t
2
Good Output Rate =
115 units/min
120