RKI Instruments SC-01 User Manual
Page 48
48 • Viewing, Printing, Exporting, and Deleting Data in the Data Window
column. A prefix of “iv” indicates an interval trend data file.
6. Click one of the interval trend data file names. A summary
will appear in the bottom right frame with instrument and
data file information. If you want to view, graph, print, or
export the interval trend data, double-click the filename or
click the View Data button at the bottom of the window.
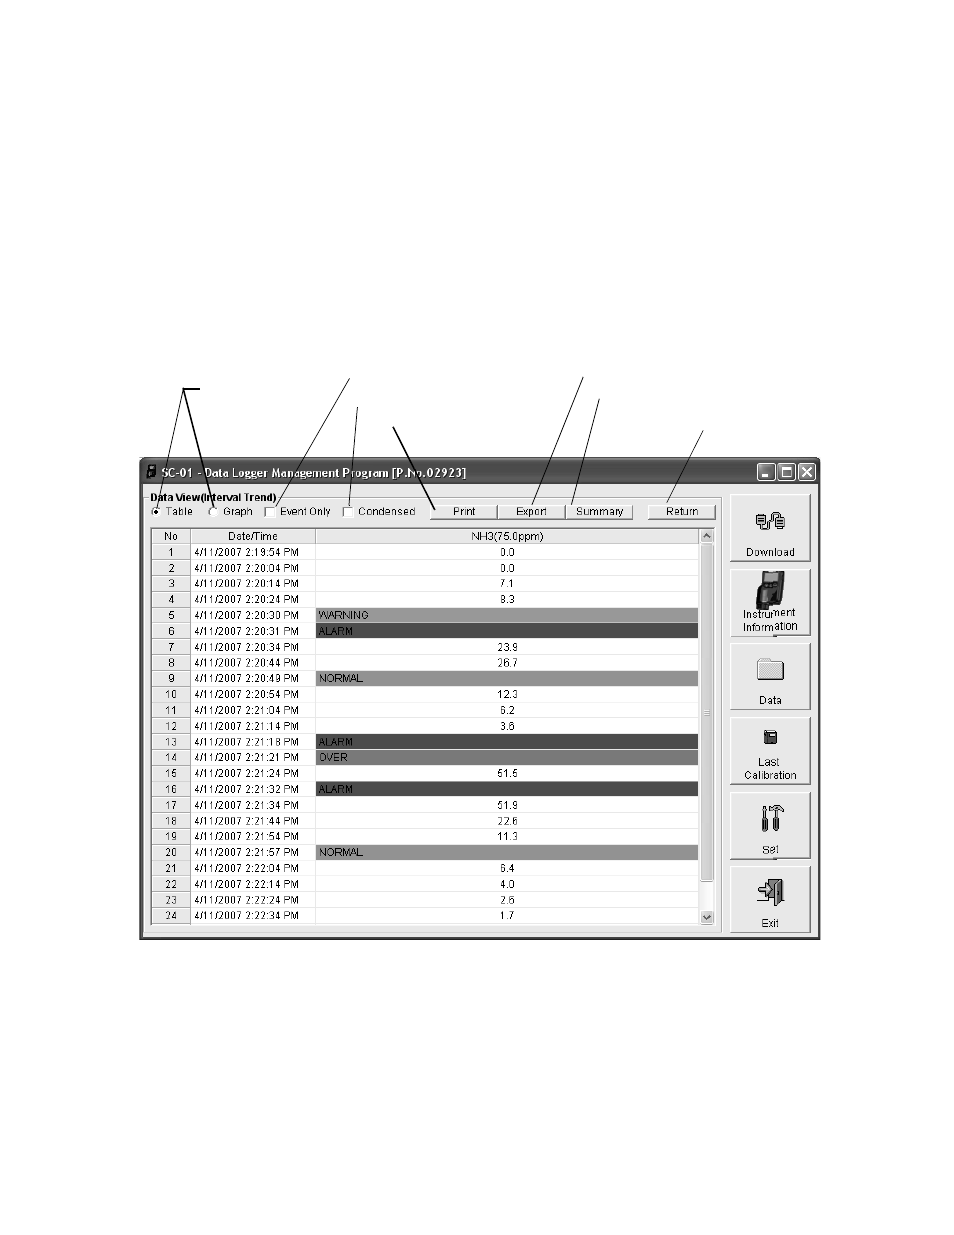
7. Interval trend data can be viewed in either table or graph
format by selecting the Table or Graph selection buttons.The
example below shows the data in table format.
•
In table format, the interval trend data is shown as the
average gas reading over the user defined interval. So if
the data logging session started at 4:13:38 PM and the
interval trend time is set to 1 minute, then the reading
Figure 37: Interval Trend Data in Table Format
Click to condense data
Click to save data to a file
Click to return
to Data window
Select Table or
Graph view
Click to see events only
Click to print data
Click to show session
summary