B. spl/leq logging – NTi Audio Minilyzer ML1 User Manual
Page 23
23
By exceeding the primary indicator range four overload arrows
replacing the dBL
eq
reading and no reading below is shown (see
Fig. 13). Select the right arrow below RNGE and press enter to
change to the next higher bargraph range. In case signal clipping
has occurred the term OVL is flashing above the RNGE field as long
as this peak, is significant influencing the integrating sound pressure
level reading. For example an SPL peak for 0.1 sec. will have effects
to the L
eq
reading for several seconds but it’s contribution can be
neglected after ten minutes.
b. SPL/LEQ Logging
The Minilyzer together with the optional MiniLINK USB PC interface
enables the data logging of all test results.
Note:
The logging function is a free add-on to the
MiniLINK, available after the registration of your test
instrument
The Minilyzer can record the SPL/LEQ curve flow, e.g. during an
event, for many hours. The results can then be loaded to a PC and
visualized as a level diagram using e.g. Microsoft Excel.
The stored results remain within the Minilyzer memory even in the
event of a battery failure during the recording session.
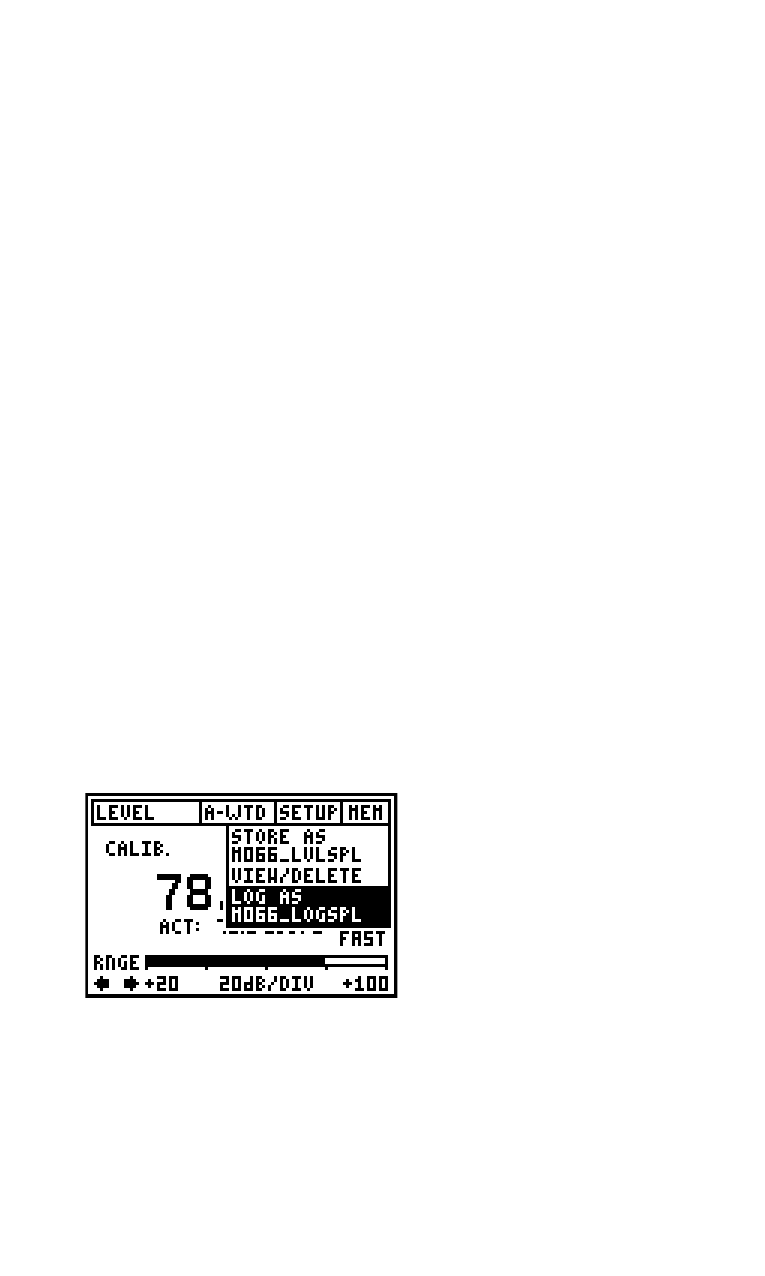
Fig 3.5 SPL Logging Start
Start SPL/LEQ logging
After the ML1 is successfully
registered, you will find
the additional "LOG AS ...“
function in the LEVEL SPL
memory menu. This feature
enables you to record the
following test results:
• Actual SPL and LEQ
value
• LEQ Overload
• At each recording interval:
SPL averaged, minimum
and maximum
Measurement Functions