HMC Electronics ASG-SD2500-10FX-SY X-PAQ Precision Fastening System User Manual
Page 30
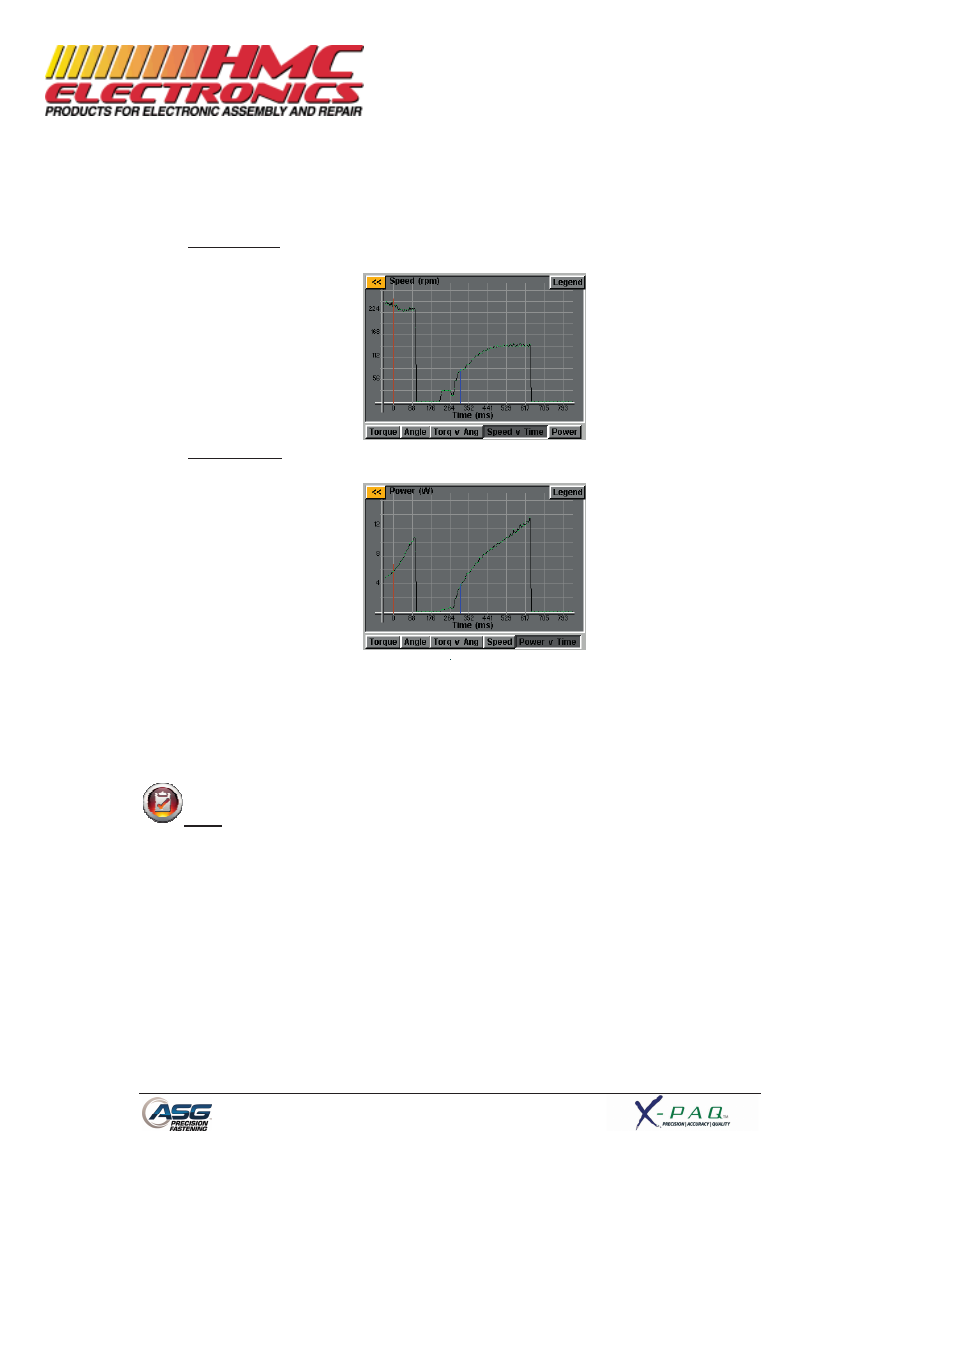
• Speed vs. Time: Graphs the last rundown with Speed on the Y axis in rotations per minute
(rpm), and Time on the X axis in milliseconds (ms).
• Power vs. Time: Graphs the last rundown with Power on the Y axis in Watts (W), and Time on
the X axis in milliseconds (ms).
In each graph there is a ‘Legend’ button on the top of the screen. Tapping this button will affix labels to
the lines overlaying each graph (where
defined by the parameter of the rundown.
just be aware that the graph will change with each cycle of the tool since the controll
most recent rundown in graph form.
NOTE: The default view of each graph begins with Time or Angle equal to 0, which is defined by
your Threshold set in the parameter of the rundown. Tapping on the graph once, will switch the view to
a wider view that begins with the time the tool is triggered
view.
Page 30
Graphs the last rundown with Speed on the Y axis in rotations per minute
(rpm), and Time on the X axis in milliseconds (ms).
raphs the last rundown with Power on the Y axis in Watts (W), and Time on
the X axis in milliseconds (ms).
In each graph there is a ‘Legend’ button on the top of the screen. Tapping this button will affix labels to
the lines overlaying each graph (where applicable) showing High Limits, Low Limits, Thresholds, etc as
defined by the parameter of the rundown. The tool can be used while the controller displays the graph,
just be aware that the graph will change with each cycle of the tool since the controller only stores the
most recent rundown in graph form.
The default view of each graph begins with Time or Angle equal to 0, which is defined by
your Threshold set in the parameter of the rundown. Tapping on the graph once, will switch the view to
wider view that begins with the time the tool is triggered. Tap one more time to return to the original
Graphs the last rundown with Speed on the Y axis in rotations per minute
raphs the last rundown with Power on the Y axis in Watts (W), and Time on
In each graph there is a ‘Legend’ button on the top of the screen. Tapping this button will affix labels to
applicable) showing High Limits, Low Limits, Thresholds, etc as
The tool can be used while the controller displays the graph,
er only stores the
The default view of each graph begins with Time or Angle equal to 0, which is defined by
your Threshold set in the parameter of the rundown. Tapping on the graph once, will switch the view to
. Tap one more time to return to the original
Documentation Provided By HMC Electronics
33 Springdale Ave. Canton, MA 02021
(800) 482-4440
- ASG-SD2500-10PL-SY X-PAQ Precision Fastening System ASG-SD2500-10PS-SY X-PAQ Precision Fastening System ASG-SD2500-20FX-SY X-PAQ Precision Fastening System ASG-SD2500-20PS-SY X-PAQ Precision Fastening System ASG-SD2500-35FX-SY X-PAQ Precision Fastening System ASG-SD2500-35PL-SY X-PAQ Precision Fastening System ASG-SD2500-35PS-SY X-PAQ Precision Fastening System ASG-SD2500-50PL-SY X-PAQ Precision Fastening System ASG-SD2500-50PS-SY X-PAQ Precision Fastening System