Google Search Appliance Analytics Integration Guide User Manual
Page 14
14
5. Name the new report tab in the Name field.
6. Select the metric groups you would like to display in the report.
For this integration, the most important groups are Content and Visitors.
7. Select the dimension drilldowns.
For this integration, the most important drilldowns are custom variable keys and values.
8. If you are unsure about what dimension and drilldowns to choose, see
examples.
9. Select Filter.
10. Select any other properties (preferably other front ends) to include in the report.
11. Click Save. Remember to set the proper date range when viewing the report.
Sample report fields
General information
Title: GSA Custom Report
Report content
Report Tab Name: Average Click Rank
Type: Flat Table
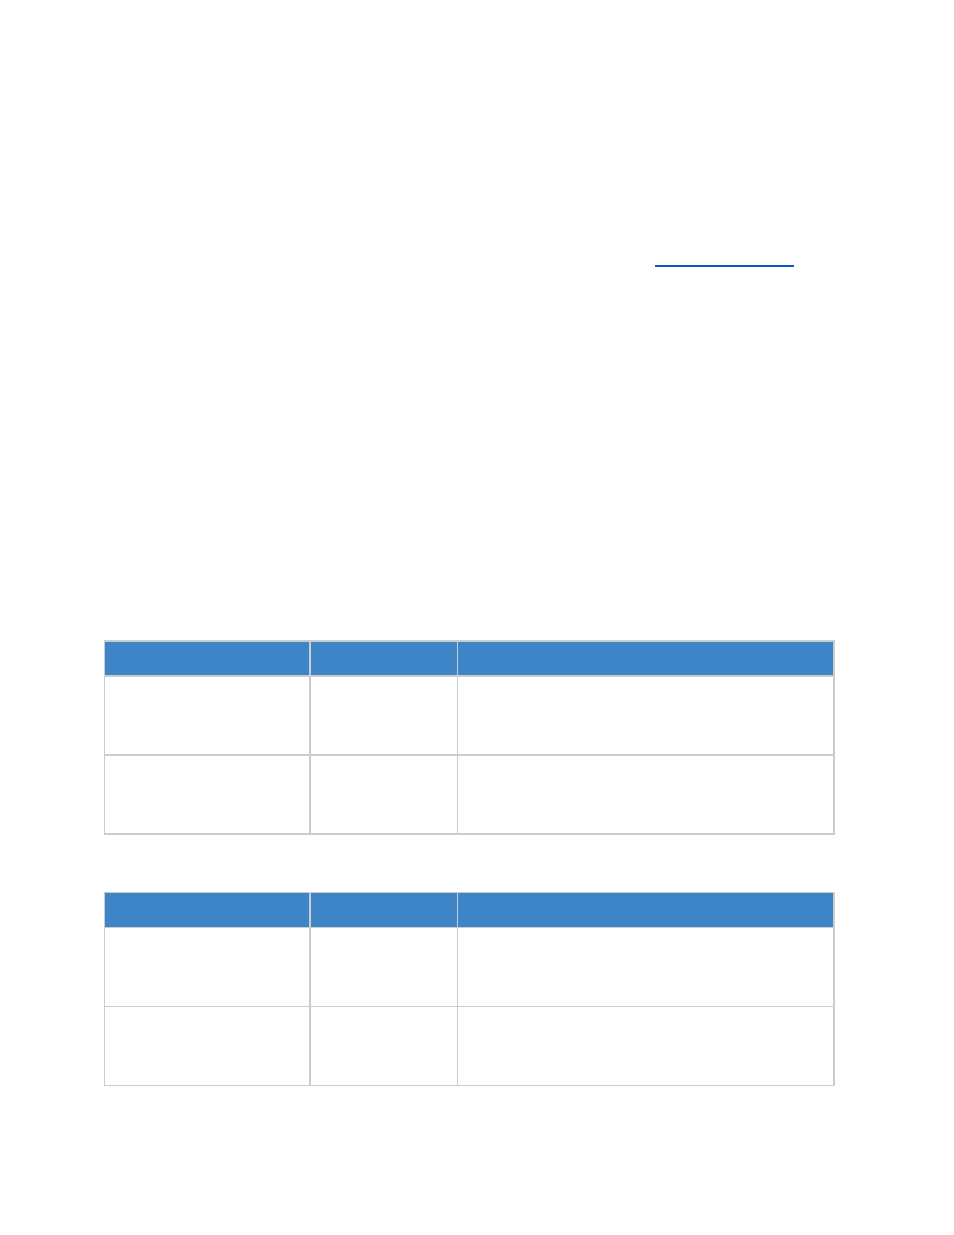
Dimension/Metrics:
Dimension
Metric
Use
Event Action
Average Value
Finds the average click rank for this event action. In
this case, you are interested in 1st Search Result
Clicks and Search Result Clicks.
Event Category
Average Value
Finds the average click rank for this event category.
In this case, you are interested in the Average
Click
Rank of the Result category.
Filters (Optional):
Filter
Value
Use
Custom Variables >
Custom Variable Value 01
default_collection
This filter makes sure that you are only viewing
Average Click Rank for the collection of your choice.
In this case, you chose default_collection.
Visitors > City
Minato
This filter shows Average Click Rank for a particular
set of users. In this case, you chose to only see the
Average Click Rank for users in Minato, Tokyo.