Cs5560 – Cirrus Logic CS5560 User Manual
Page 22
CS5560
22
DS713PP2
5/4/09
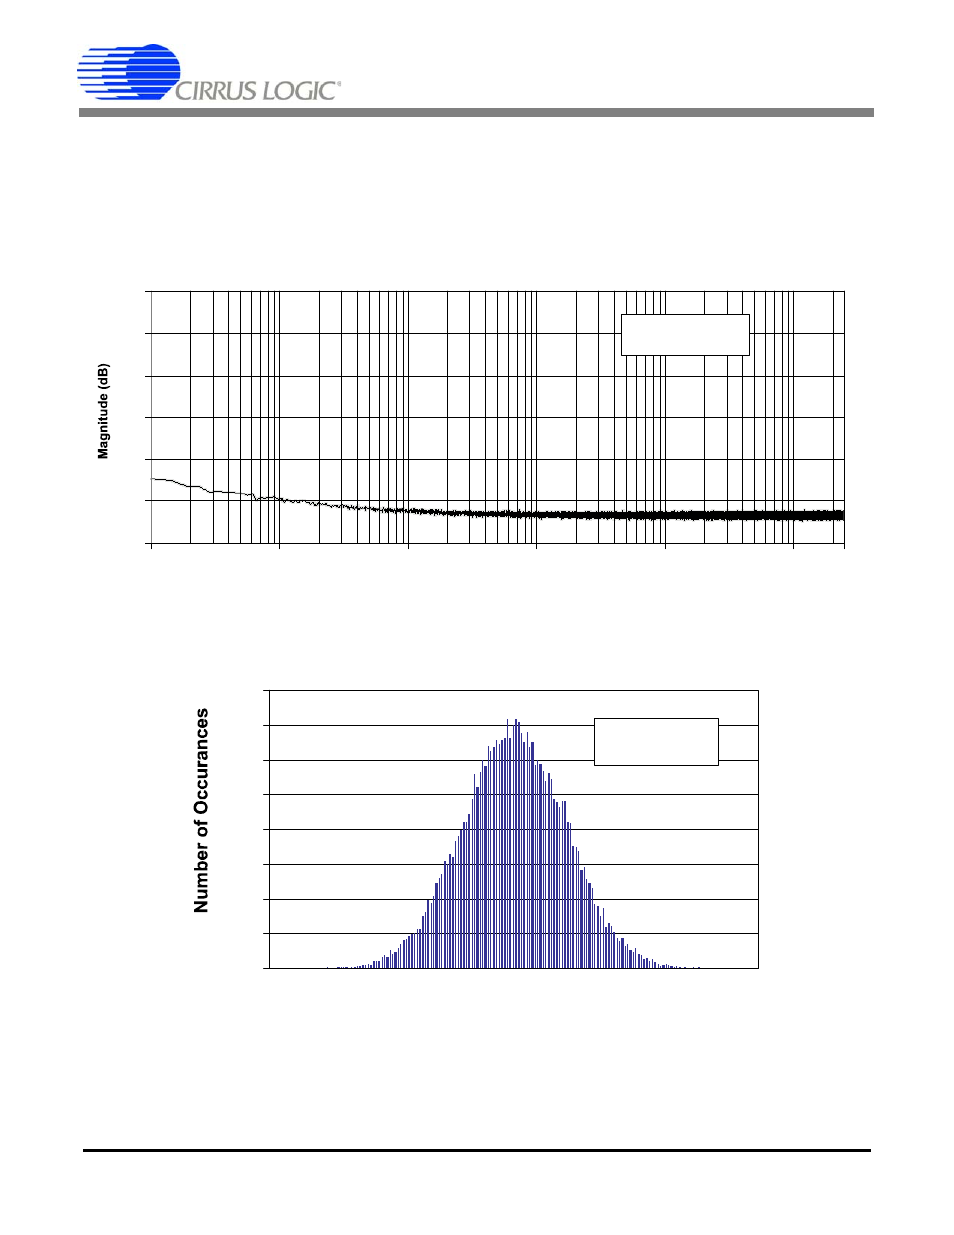
illustrates the noise floor of the converter from 0.1 Hz to 25 kHz. While the plot does exhibit
some 1/f noise at lower frequencies, the noise floor is entirely free of spurious frequency content due to
digital activity inside the chip.
illustrates a noise histogram of 32,768 samples.
-180
-160
-140
-120
-100
-80
-60
0.1
1
10
100
1k
10k
25k
Frequency (Hz)
Shorted Input
1M Samples @ 50 kSps
64 Averages
Figure 17. Spectral Plot of Noise with Shorted Input
0
100
200
300
400
500
600
700
800
Output (Codes)
Std. Dev. = 19.0
Max - Min = 178
Figure 18. Noise Histogram (32k Samples)
See also other documents in the category Cirrus Logic Hardware:
- CobraNet (147 pages)
- CS4961xx (54 pages)
- CS150x (8 pages)
- CS1501 (16 pages)
- CS1601 (2 pages)
- CS1601 (16 pages)
- CS1610 (16 pages)
- CRD1610-8W (24 pages)
- CRD1611-8W (25 pages)
- CDB1610-8W (21 pages)
- CS1610A (18 pages)
- CDB1611-8W (21 pages)
- CDB1610A-8W (21 pages)
- CDB1611A-8W (21 pages)
- CRD1610A-8W (24 pages)
- CRD1611A-8W (25 pages)
- CS1615 (16 pages)
- AN403 (15 pages)
- AN401 (14 pages)
- AN400 (15 pages)
- AN375 (27 pages)
- AN376 (9 pages)
- CRD1615-8W (22 pages)
- CRD1616-8W (23 pages)
- AN402 (14 pages)
- AN404 (15 pages)
- CRD1615A-8W (21 pages)
- CS1615A (16 pages)
- CS1630 (56 pages)
- AN374 (35 pages)
- AN368 (80 pages)
- CRD1630-10W (24 pages)
- CRD1631-10W (25 pages)
- CS1680 (16 pages)
- AN405 (13 pages)
- AN379 (31 pages)
- CRD1680-7W (31 pages)
- AN335 (10 pages)
- AN334 (6 pages)
- AN312 (14 pages)
- AN Integrating CobraNet into Audio Products (16 pages)
- CobraNet Audio Routing Primer (9 pages)
- Bundle Assignments in CobraNet Systems (3 pages)
- CS2300-01 (3 pages)
- CS2000-CP (38 pages)