6 frequency domain information, 1 s/pn, 2 sinad – Cirrus Logic CS5550 User Manual
Page 16: 3 s/d, 4 snr, 5 frequency, 6 magnitude, 7 # of avg, Figure 10. cdb5550 frequency domain plot, Cdb5550
CDB5550
16
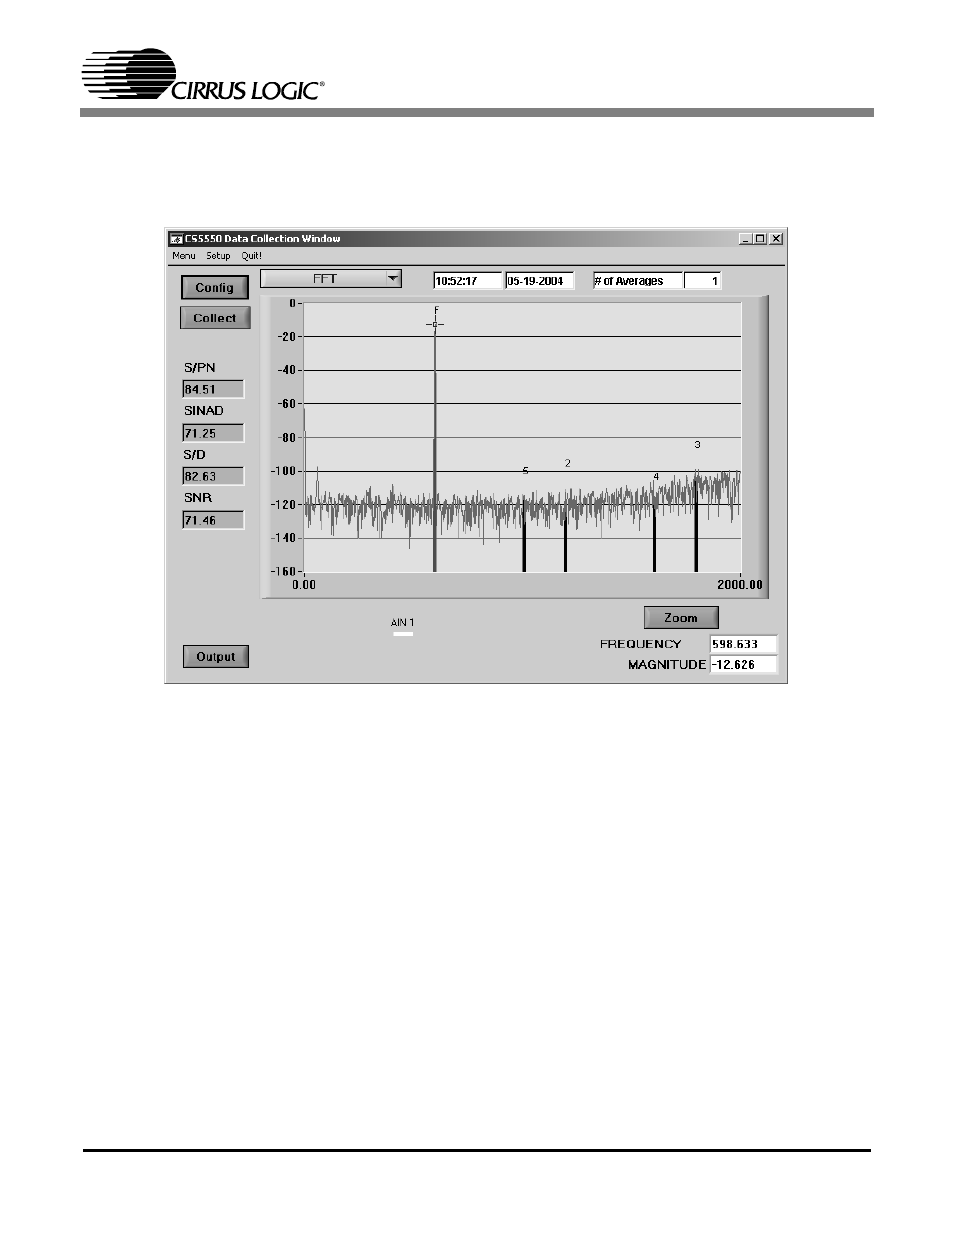
2.6 Frequency Domain Information
The following describes the indicators associated with FFT (Fast Fourier Transform) Analysis. FFT data
can be plotted in the Data Collection Window by setting the Time Domain / FFT / Histogram selector to FFT.
Figure 10 illustrates a typical Frequency Domain plot.
Figure 10. CDB5550 Frequency Domain Plot
2.6.1 S/PN
Indicator for the Signal-to-Peak Noise Ratio (decibels).
2.6.2 SINAD
Indicator for the Signal-to-Noise + Distortion Ratio (decibels).
2.6.3 S/D
Indicator for the Signal-to-Distortion Ratio, 4 harmonics are used in the calculations (decibels).
2.6.4 SNR
Indicator for the Signal-to-Noise Ratio, first 4 harmonics are not included (decibels).
2.6.5 FREQUENCY
Displays the x-axis value of the cursor on the FFT display.
2.6.6 MAGNITUDE
Displays the y-axis value of the cursor on the FFT display.
2.6.7 # of AVG
Displays the number of FFT’s averaged in the current display.