11 histogram information, Figure 26. histogram analysis, Cdb5490u – Cirrus Logic CDB5490U User Manual
Page 32
CDB5490U
32
DS923DB5
2.8.1.11
Histogram Information
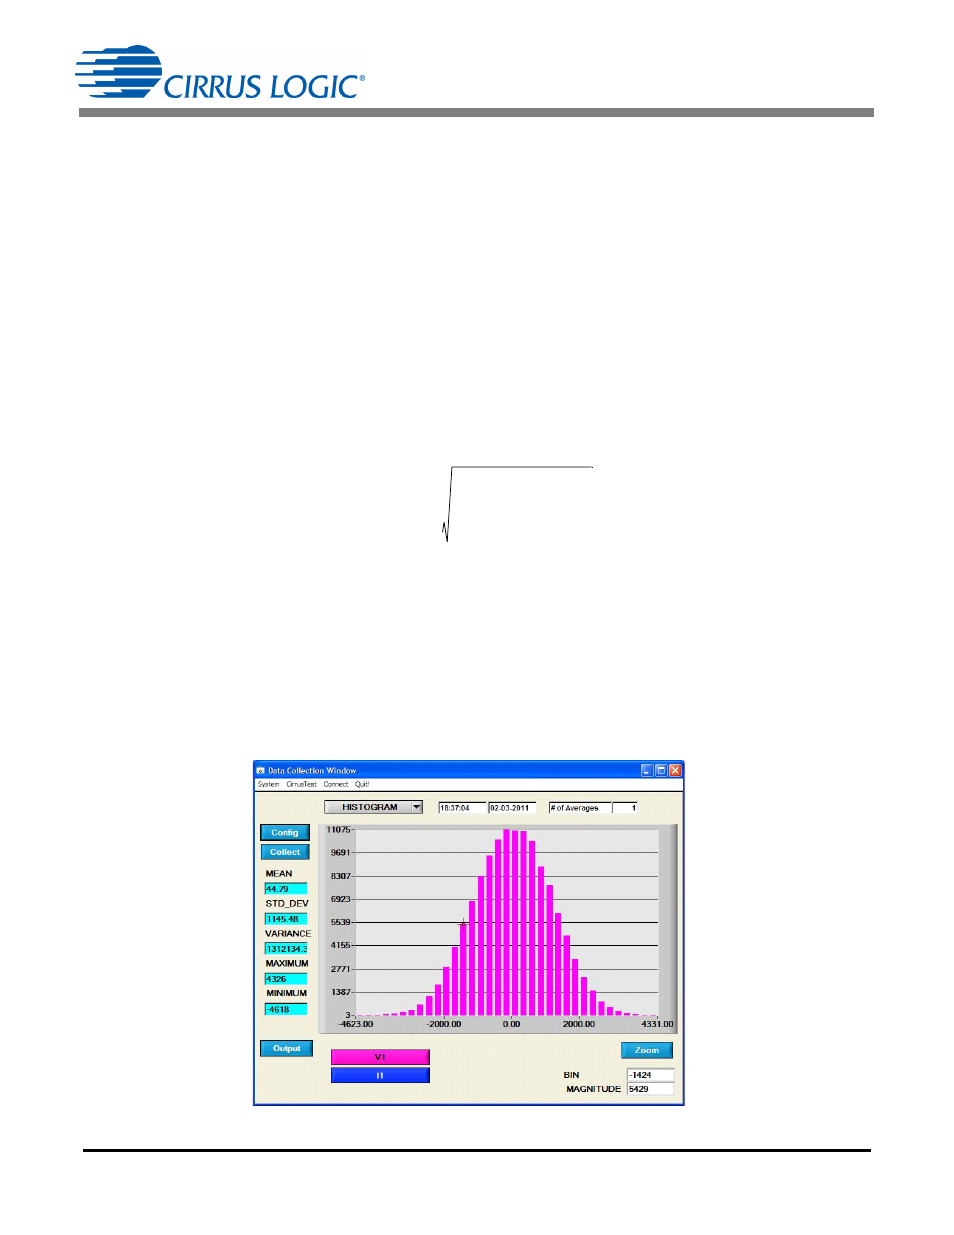
The following is a description of the indicators associated with histogram analysis. Histograms can be plot-
ted in the Data Collection Window by setting the analysis type pull-down menu to Histogram (see
Figure 26). The histogram plot information includes:
• BIN: Displays the x-axis value of the cursor on the histogram.
• MAGNITUDE: Displays the y-axis value of the cursor on the histogram.
• MEAN: Indicates the mean of the data sample set. The mean is calculated using the following
formula:
• STD_DEV: Indicates the standard deviation of the collected data set. The standard deviation is
calculated using the following formula:
• VARIANCE: Indicates the variance of the current data set. The variance is calculated using the
following formula:
• MAXIMUM: Indicates the maximum value of the collected data set.
• MINIMUM: Indicates the minimum value of the collected data set.
MEAN
Xi
i
0
=
n 1
–
n
---------------------------
=
STDDEV
Xi Mean
–
i
0
=
n 1
–
n
------------------------------------------------------
2
=
VARIANCE
Xi Mean
–
i
0
=
n 1
–
n
------------------------------------------------------
2
=
Figure 26. Histogram Analysis