1 data collection window, 1 time domain / fft/ histogram selector, 2 config button – Cirrus Logic CDB5490U User Manual
Page 28: 3 collect button, Figure 22. data collection window, Figure 23. data collection uart error message, Cdb5490u
CDB5490U
28
DS923DB5
2.8.1
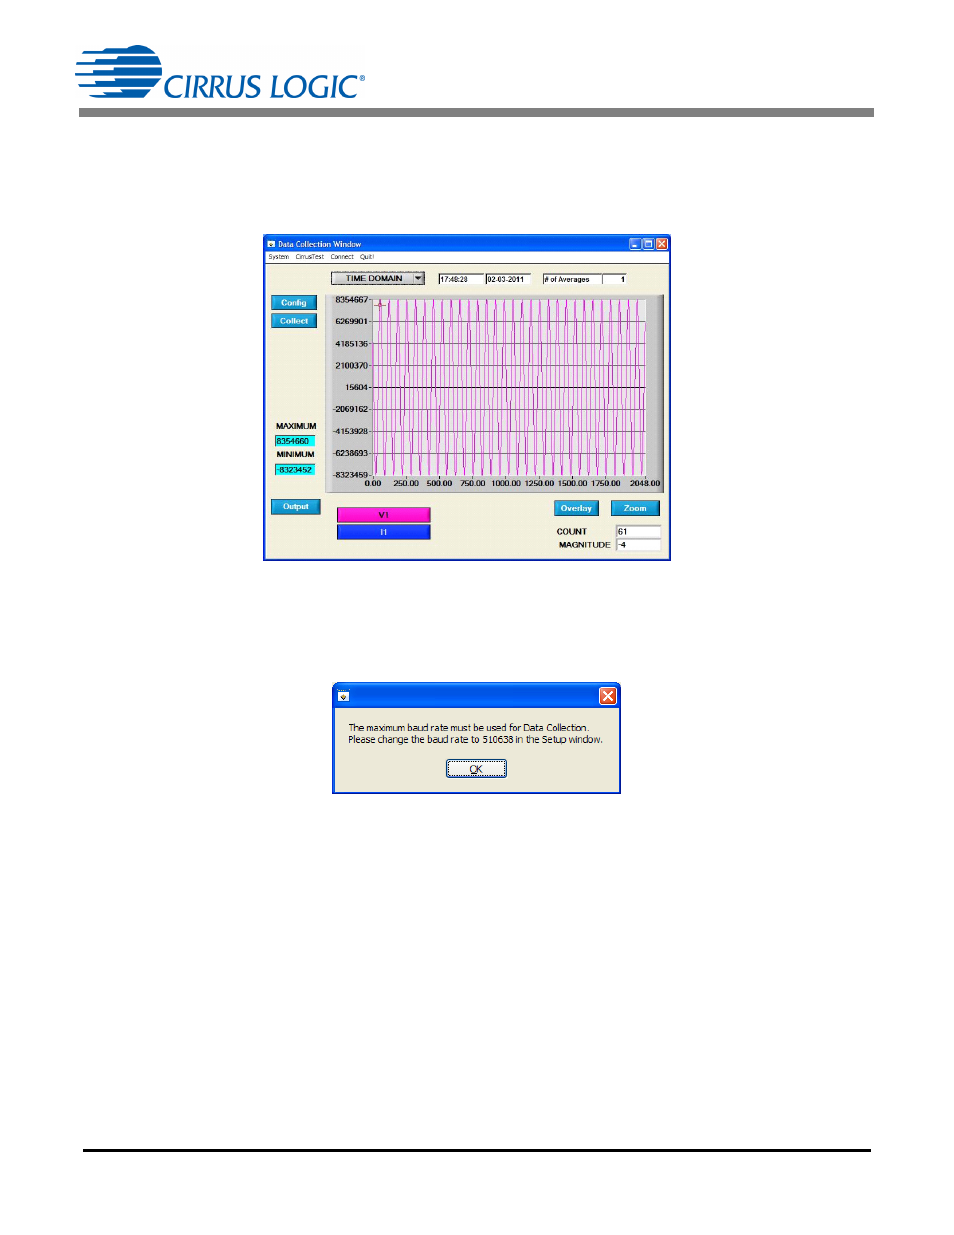
Data Collection Window
The Data Collection Window allows the user to collect sample sets of data from the CS5490 and analyze
them using time domain, FFT, and histogram plots. The Data Collection window can be accessed by pull-
ing down the CirrusTest menu, and selecting the ADC Data Collection item (see Figure 22).
The Data Collection Window can only be accessed when the UART is operating at 510638 baud. When
UART serial communication is enabled, an error window is displayed (see Figure 23). The baud rate is
selected within the Setup Window (see Figure 18).
2.8.1.1
Time Domain / FFT/ Histogram Selector
The Time Domain/FFT/Histogram selector selects the type of data processing to perform on the collected
data and displays the results in the plot area. Refer to “Analyzing Data” on page 31 for more information.
2.8.1.2
Config Button
The Config button will bring up the Configuration window, in which the user can modify the data collection
specifications. Refer to “Configuration Window” on page 30 for more information.
2.8.1.3
Collect Button
The Collect button will collect data from the part, to be analyzed in the plot area. See “Collecting Data
Sets” on page 31 for more information.
Figure 22. Data Collection Window
Figure 23. Data Collection UART Error Message