6 performance plots, Performance plots – Cirrus Logic CDB42L55 User Manual
Page 19
DS773DB1
19
CDB42L55
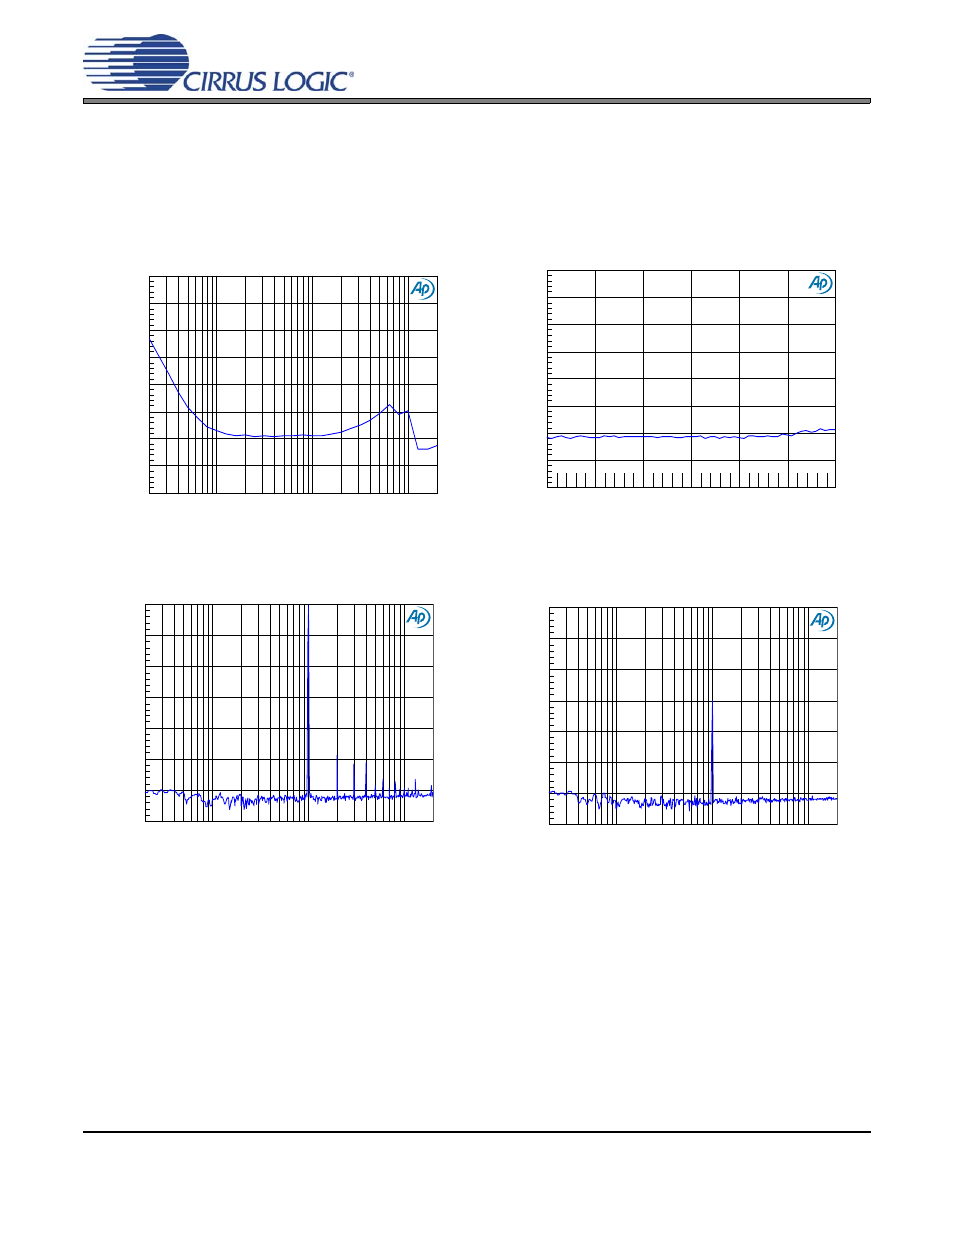
6 PERFORMANCE PLOTS
Test conditions (unless otherwise specified): T
A
= 25°C; VA=VCP=VLDO=VL=1.8 V; input test signal is a full-scale
997 Hz sine wave; dB values relative to full-scale output; measurement bandwidth 20 Hz to 20 kHz (un-weighted);
sample frequency = 48 kHz; +2 dB analog gain for Line Output path; -4 dB analog gain for Headphone Output path;
headphone test load: R
L
= 16
Ω; no LPF option for Headphone Output path.
Note:
The total harmonic distortion + noise (THD+N) performance of the ADC in the CS42L55 is determined
by the value of the capacitor on the FILT+ pin. Larger capacitor values yield significant improvement
in THD+N at low frequencies.
shows the THD+N vs. frequency performance measured with a
2.2 µF capacitor.
-100
-60
-95
-90
-85
-80
-75
-70
-65
d
B
F
S
20
20k
50
100
200
500
1k
2k
5k
10k
Hz
-100
-60
-95
-90
-85
-80
-75
-70
-65
d
B
F
S
-60
-10
-50
-40
-30
-20
dBr
Figure 10. THD+N vs Freq. - Analog In to Digital Out
Figure 11. THD+N vs Amplitude - Analog In to Digital Out
-140
+0
-120
-100
-80
-60
-40
-20
d
B
F
S
20
20k
50
100
200
500
1k
2k
5k
10k
Hz
-140
+0
-120
-100
-80
-60
-40
-20
d
B
F
S
20
20k
50
100
200
500
1k
2k
5k
10k
Hz
Figure 12. FFT - Analog In to Digital Out @ -1 dBFS
Figure 13.
FFT - Analog In to Digital Out @ -60 dBFS
F
i
1
0