Asante Technologies 100 User Manual
Page 42

Management
Page 3-30
Viewing Statistics
Statistics for an AsantéFAST 100 Hub stack can be viewed in two differ-
ent formats: table or graph. Statistics collected include runts, alignment
errors, late collisions, short events, good frames, and bad frames.
Table Statistics
1
Select a group or a port for which statistics are to be
gathered by clicking on it once. To view statistics for
the device (entire hub stack), do NOT select anything.
2
Click
Table.
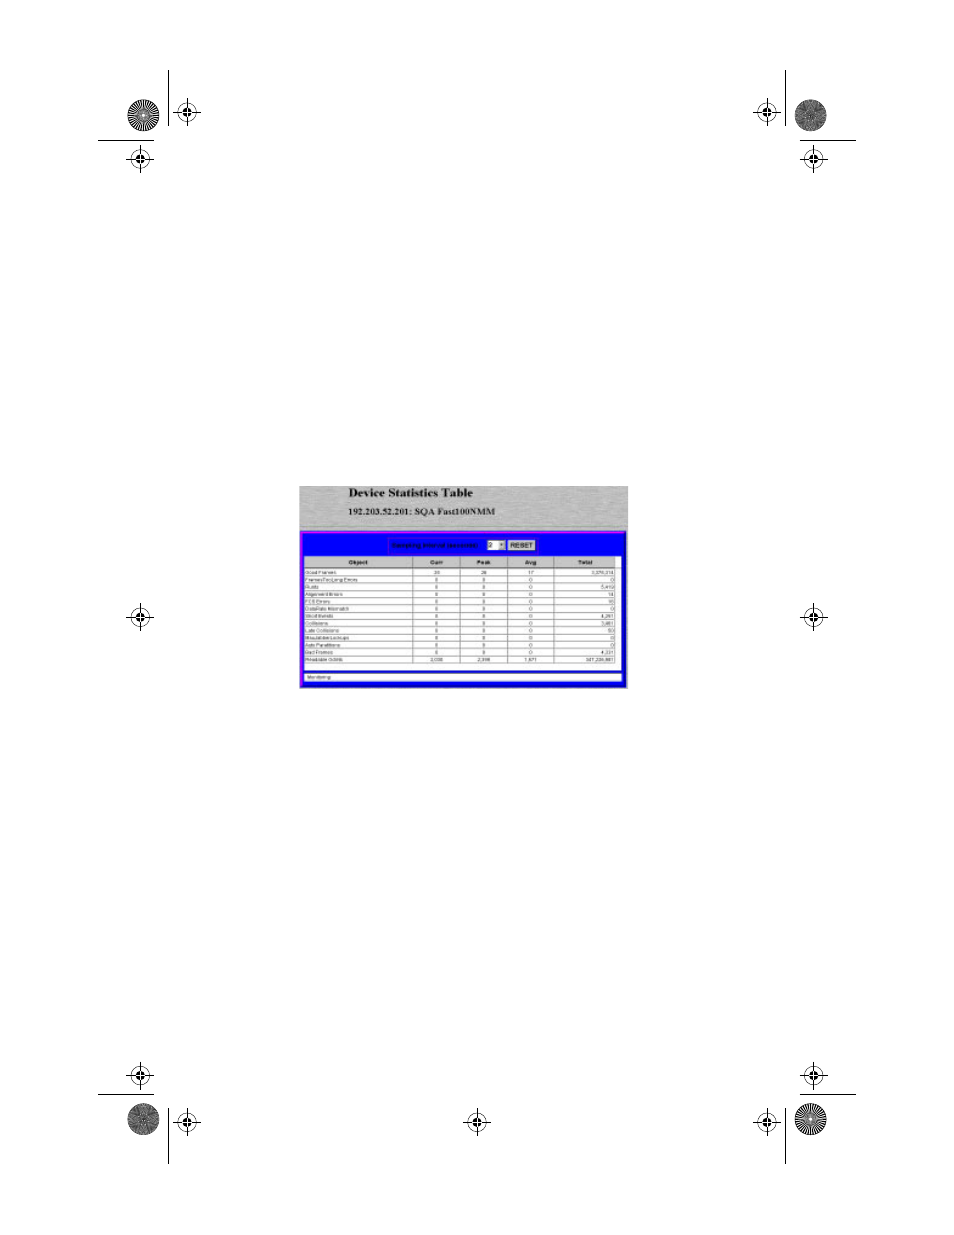
Table statistics appear for the group, port, or device
selected, similar to Figure 3-27.
Figure 3-27
Table Statistics
For a description of each object, see “Statistics” on
page 4-17.
3
Open the
Sampling Interval drop-down menu and
select the number of seconds to poll for statistics.
Statistics are automatically gathered in the following col-
umns:
❏
Curr — (current) the number of occurrences each second.
❏
Peak — the largest number of occurrences since
opening or resetting the screen.
❏
Avg — (average) the average number of occur-
rences since opening or resetting the screen.
❏
Total — the total number of occurrences since
opening or resetting the screen.
4
Click
Reset to reset the counters to zero.
100NMM PM book Page 30 Wednesday, August 27, 1997 12:40 PM
