Output temperature chart, Page – State GTS-110-NI User Manual
Page 50
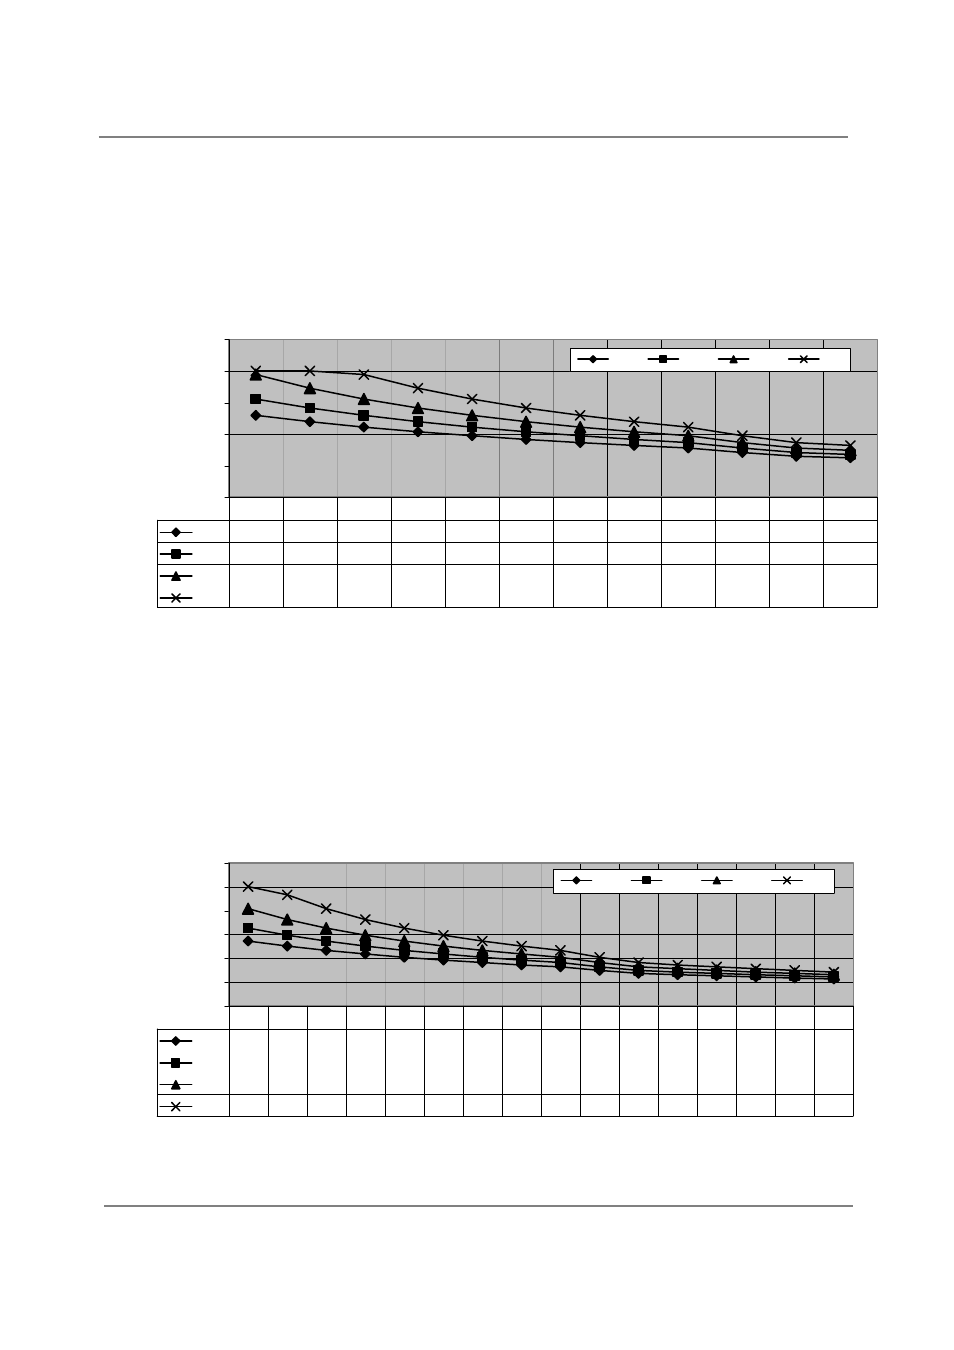
Output Temperature Chart
50
│
Page
Output Temperature vs. GPM (Max. 8.0 GPM) with Various Inlet Water Temperature
0.0
2.0
4.0
6.0
8.0
10.0
Out
Put H
o
t Wa
te
r GP
M
40 F
50 F
60 F
70 F
40 F
5.2
4.8
4.4
4.1
3.9
3.7
3.5
3.3
3.1
2.8
2.6
2.5
50 F
6.2
5.7
5.2
4.8
4.4
4.1
3.9
3.7
3.5
3.1
2.8
2.7
60 F
7.8
6.9
6.2
5.7
5.2
4.8
4.4
4.1
3.9
3.5
3.1
3.0
70 F
8.0
8.0
7.8
6.9
6.2
5.7
5.2
4.8
4.4
3.9
3.5
3.3
100
105
110
115
120
125
130
135
140
150
160
165
Output Temperature vs. GPM (Max. 10.0 GPM) with Various Inlet Water Temperature
0.0
2.0
4.0
6.0
8.0
10.0
12.0
O
u
t P
u
t
H
o
t W
a
ter
G
P
M
40 F
50 F
60 F
70 F
40 F
5.4
5.0
4.7
4.3
4.1
3.8
3.6
3.4
3.3
3.0
2.7
2.6
2.5
2.4
2.3
2.2
50 F
6.5
5.9
5.4
5.0
4.7
4.3
4.1
3.8
3.6
3.3
3.0
2.8
2.7
2.6
2.5
2.4
60 F
8.1
7.2
6.5
5.9
5.4
5.0
4.7
4.3
4.1
3.6
3.3
3.1
3.0
2.8
2.7
2.6
70 F
10.0
9.3
8.1
7.2
6.5
5.9
5.4
5.0
4.7
4.1
3.6
3.4
3.3
3.1
3.0
2.8
100
105
110
115
120
125
130
135
140
150
160
165
170
175
180
185
*When the set temperature is 131°F or higher, maximum flow rate is limited to 8.0 GPM.
510 (T‐D2) models
310 (T‐K4) models