Selecting incidents in the table, Table displays 100 incidents at a time, You control the table’s content – Milestone Analytics 2.2 User Manual
Page 14: Sorting table columns, Filtering table columns
Milestone XProtect Analytics 2.2; User’s Manual
www.milestonesys.com
Page 14
Day-to-Day Use
Source: Lists the surveillance system server hosting the camera by which the incident was
detected.
Time: Lists the time at which the incident was detected.
Vendor: Lists the video content analysis software on which the incident detection was
based.
Selecting Incidents in the Table
To view video from a detected incident, you select the required incident in the table in the bottom
part of the view. The table may contain large amounts of incidents, so it is important that you
know how to navigate the table itself.
Table Displays 100 Incidents at a Time
To allow for optimum performance, the table displays a maximum of 100 incidents at a time. To
browse to the previous/next 100 incidents, simply use the buttons in the bottom
right part of the table.
You Control the Table’s Content
You decide which columns to display in the table, and in which
order they appear. To select which columns to display, click the
button to the left of the column headings. To arrange the order
of columns, simply drag them to the required positions.
Sorting Table Columns
To sort columns alphabetically, by time, etc., simply click the required column heading.
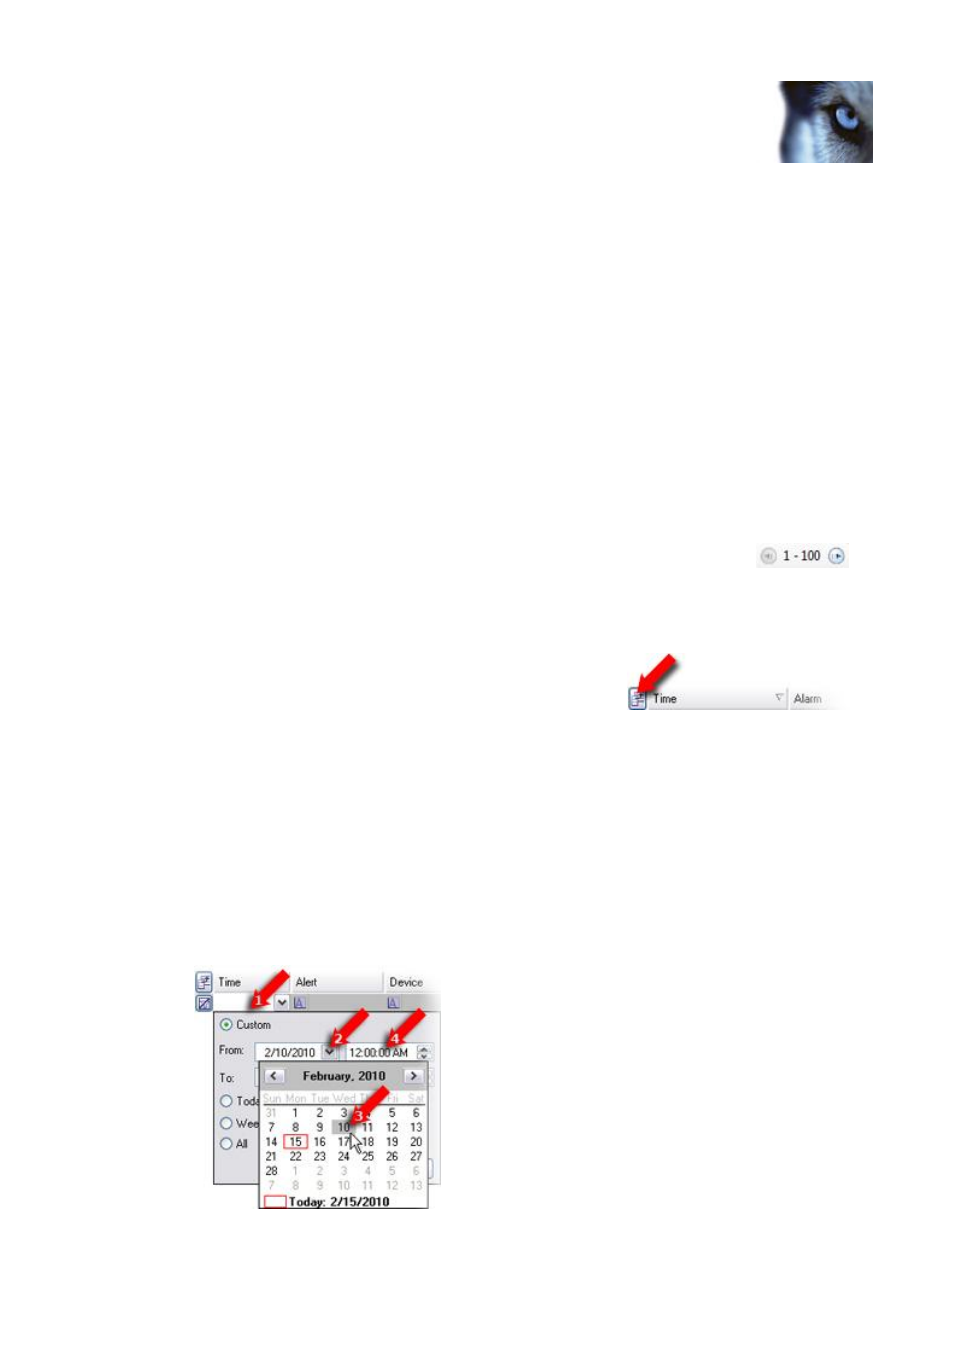
Filtering Table Columns
You can filter content in the table’s columns in three ways:
To filter on a specific date/time period, click in the row below the Time column heading (
1
in the example), select Custom, click the required date drop-down menu (
2
), select
required date (
3
), then required time (
4
):