Colored overlays, Time synchronization slider – Milestone Analytics 2.2 User Manual
Page 12
Milestone XProtect Analytics 2.2; User’s Manual
www.milestonesys.com
Page 12
Day-to-Day Use
Time: Lists the time at which the incident was detected.
Vendor: Lists the video content analysis software on which the incident detection was
based.
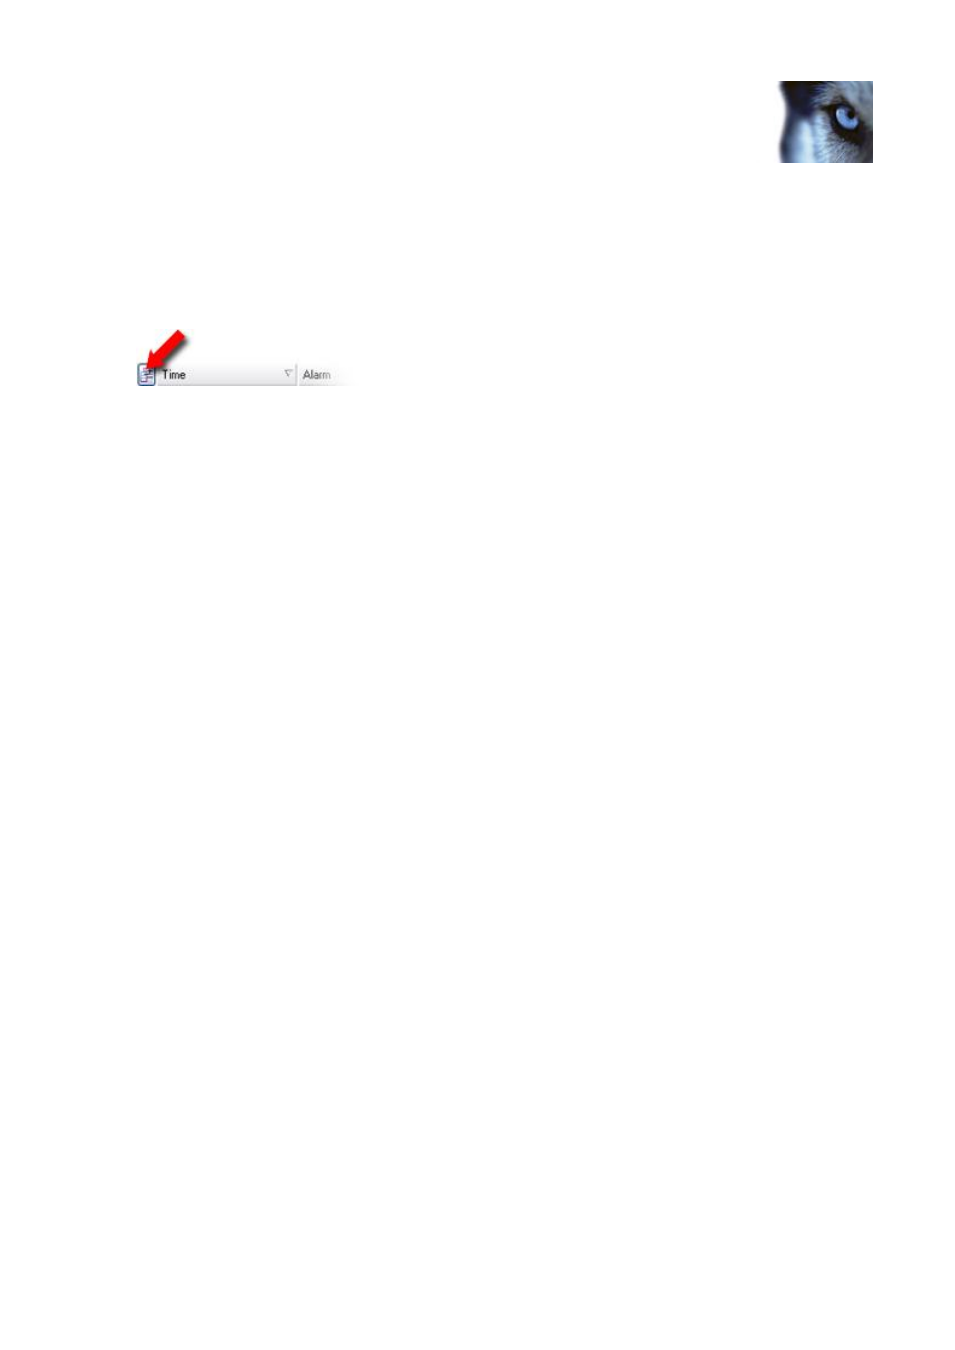
Tip: You decide which columns to display in the table, and in which order they appear. To select
which columns to display, click the button to the left of the column headings (see example below).
To arrange the order of columns, simply drag them to the required positions.
For more information about the Smart Client’s live viewing features, refer to the XProtect Smart
Client User’s Manual, available from your surveillance system administrator or from
www.milestonesys.com.
Colored Overlays
In analytics views an image from the latest detected incident will be displayed in the view’s top
right position. This image contains an overlay in one or more colors. For more information about
interpreting the different overlay colors, see page 16.
Time Synchronization Slider
Analytics views feature a time synchronization slider for synchronizing images in the analytics
image capture position in the view’s top right position with the video displayed in the view’s top left
position. For more information about using the slider, see page 17.