Browsing recorded video & analytics data, Selecting an analytics view, View’s structure – Milestone Analytics 2.2 User Manual
Page 13
Milestone XProtect Analytics 2.2; User’s Manual
www.milestonesys.com
Page 13
Browsing Recorded …
Browsing Recorded Video & Analytics
Data
The Smart Client lets you view analytics data combined with matching, time-linked, recorded video.
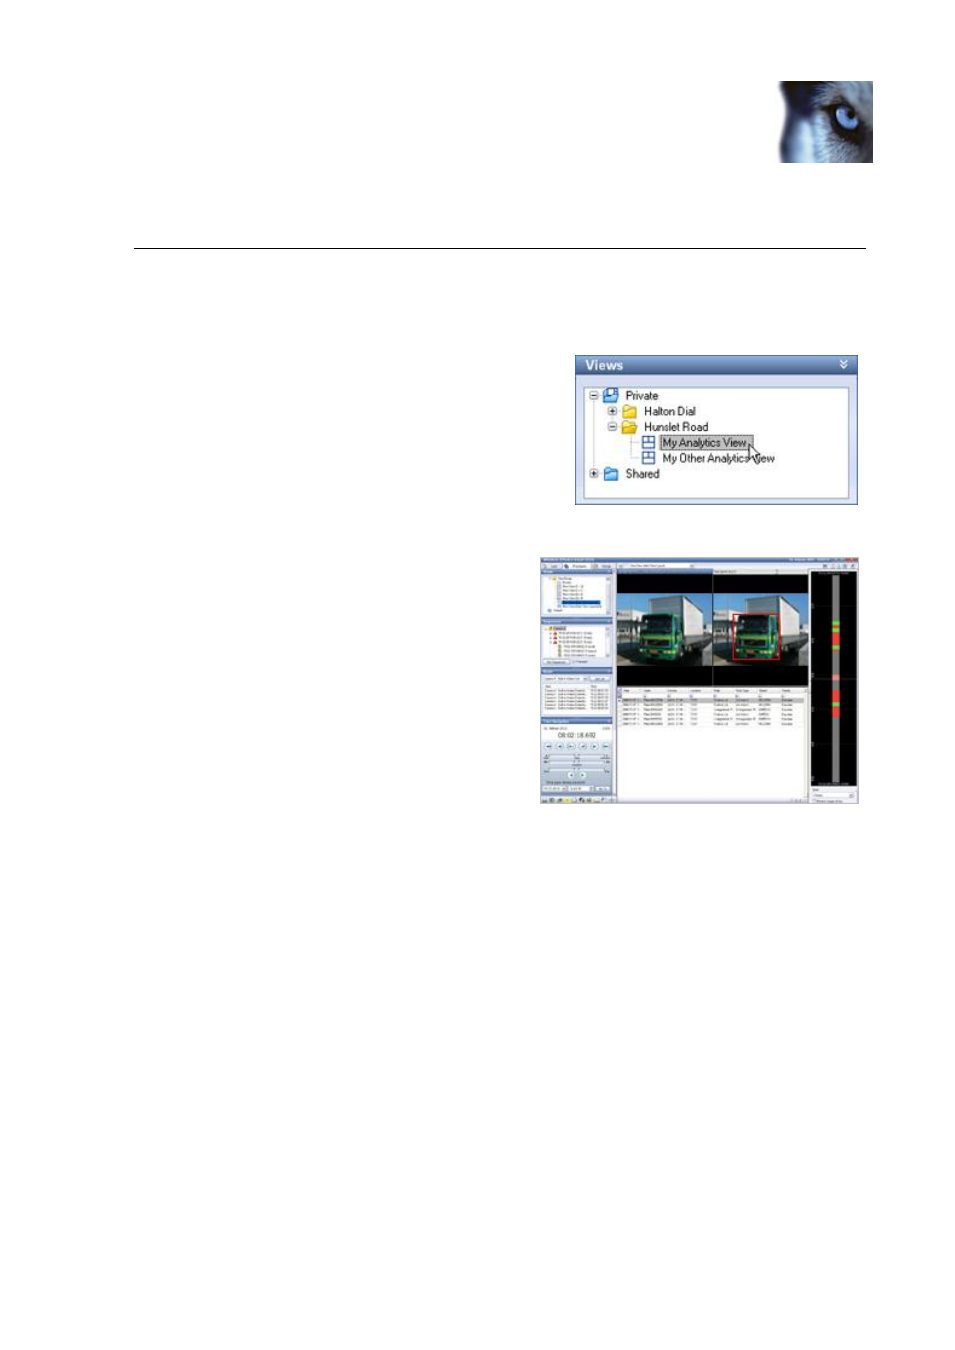
Selecting an Analytics View
1. Go to the Smart Client’s Playback tab.
2. In the Views section, select the required view.
View’s Structure
Data about relevant incidents will be displayed in the
view’s bottom area, matching recorded video will be
displayed in the view’s top left position, and an
image from the selected incident will be displayed in
the view’s top right position.
Each incident can be displayed with information in
the following columns:
Alarm: Lists the type of incident detected,
for example motion or a license plate.
Alert Type: Lists the category of incident.
Confidence: Lists a value between 1 and
1000 describing the confidence level for the detection. Example: A value of 950 means that
the XProtect Analytics solution is at least 950/1000 certain that it has made a correct
detection. You will typically not see very low confidence values since it is possible to set a
minimum acceptable confidence level on the server.
Description: Lists a summary of the detection.
Device: Lists the camera by which the incident was detected.
Location: Lists the location of the camera by which the incident was detected.
Object: Lists the object detected.
Object Type: Lists the category of object detected.
Rule: Lists the XProtect Analytics rule triggered by the detection of the incident.
Rule Type: Lists the category of XProtect Analytics rule triggered by the detection of the
incident.