The gdl summary screen, Gdl graph screen – Dwyer GDL User Manual
Page 23

DwyerLog User’s Guide
Versin 1.2x
23/25
The GDL Summary Screen
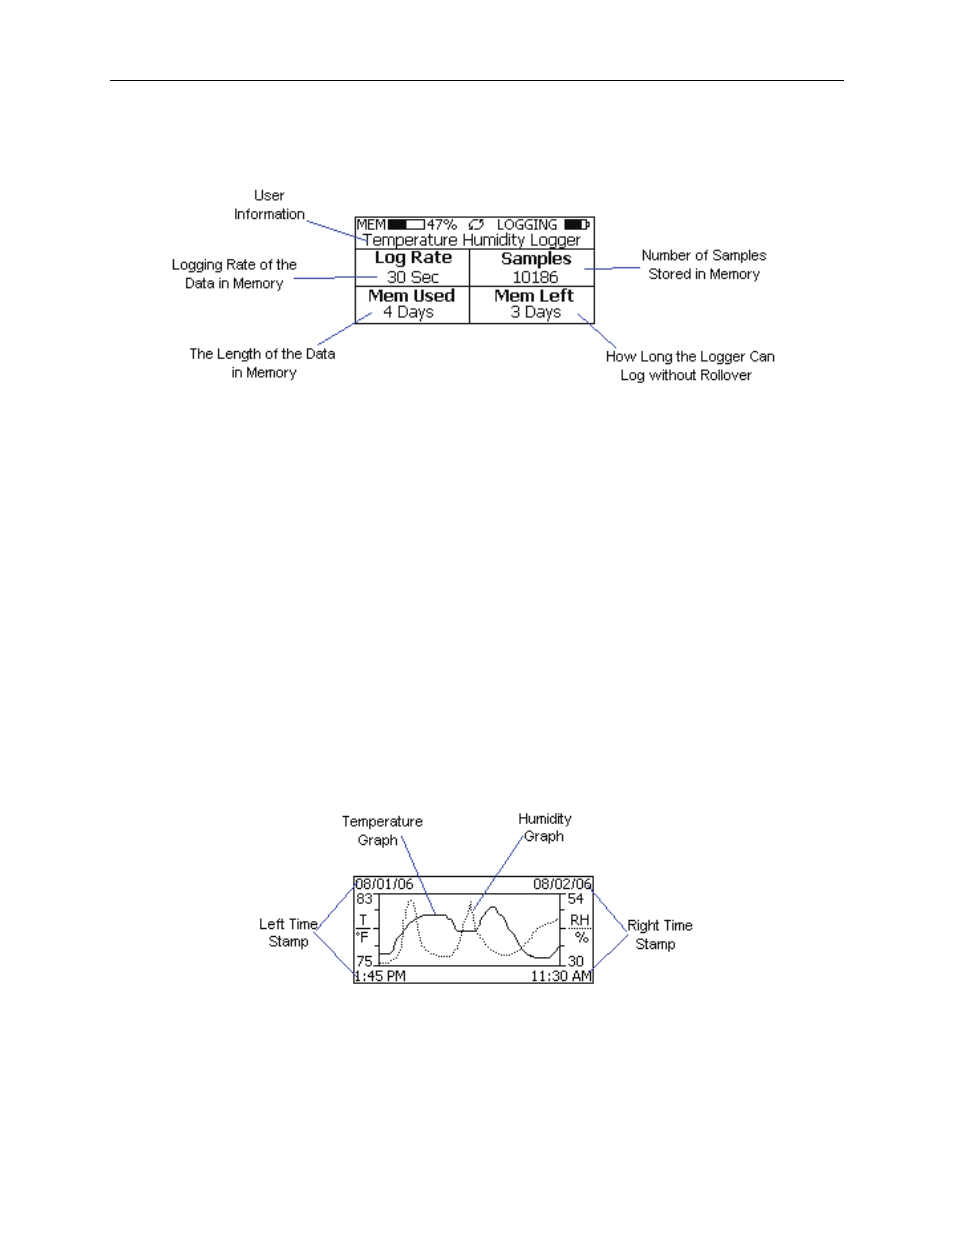
The Summary screen is shown below.
The icons in the summary screen are identical to the icons in the Sample screen. The Summary screen shows:
• The User Information: This 30 character text field is entered through the DwyerLog setup software, and
can be any text that describes the logger
• Logging Rate: Is the rate at which the data in memory was logged at.
• Samples: Shows the number of samples stored in memory. If a rollover has occurred this number will
show the maximum number of samples that can be stored in the logger, and will not change, even though
the logger may be logging.
• Mem Used: Shows the length (in days, hours, minutes or seconds) of data currently stored in memory. If a
rollover has occurred, this number will show the maximum length of data that can be stored in memory, for
a given sample rate. If a rollover has occurred, this number will not change even though the logger may be
logging.
• Mem Left: Shows the length (in days, hours, minutes or seconds) of data the logger can record without
overwriting currently recorded data (record without a rollover). If a rollover has occurred, this number will
show 0 Sec, even though the logger may still be logging.
GDL Graph Screen
The GDL is capable of displaying the logged data graphically to show temperature and relative humidity trends.
The GDL Graph screen is shown below.
This screen shows the graph of the samples stored in logger memory. The temperature graph is shown with a solid
line. The temperature axis is on the left. The humidity graph is shown with a dotted line. The humidity axis is on
the right. The graph time stamps are shown on the left and on the right, above the axis.
For instance, in the graph above, data collected between August 1st, 2006, 1:45 PM and August 2nd, 11:30 AM is
shown. The graph temperature range is between 75°F and 83°F. The relative humidity range is between 30%RH
and 54%RH.
