Thermo Fisher Scientific Alpha DO 1000 User Manual
Page 44
36
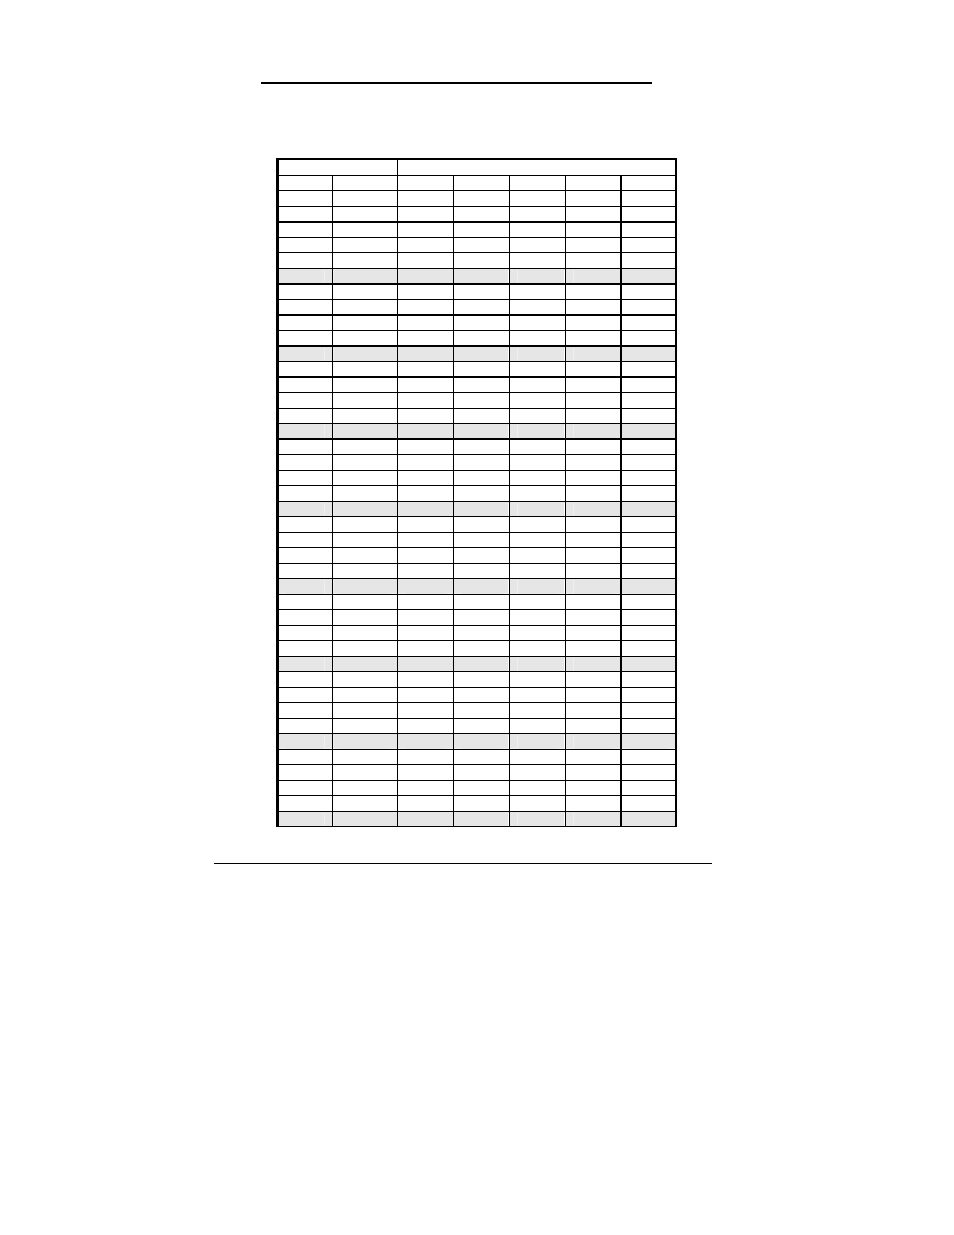
12.2 Appendix 2 – Salinity vs Temperature (@ 760 mmHg)
The following table shows the Dissolved Oxygen values at different salinity values,
at different temperatures, at barometric pressure of 760 mmHg. For other pressure
levels, the controller automatically corrects the value based on the pressure value
input.
Temperature Salinity-
ppm
o
C
o
F 0 10
20
30
40
0
32.0 14.6 13.8 13.0 12.1 11.3
1
33.8 14.2 13.4 12.6 11.8 11.0
2
35.6 13.8 13.1 12.3 11.5 10.8
3
37.4 13.4 12.7 12.0 11.2 10.5
4
39.2 13.1 12.4 11.7 11.0 10.3
5
41.0
12.7
12.1
11.4
10.7
10.0
6
42.8 12.8 11.8 11.1 10.5 9.8
7
44.6 12.1 11.5 10.9 10.2 9.6
8
46.4 11.8 11.2 10.6 10.0 9.4
9 48.2
11.5
11.0
10.4
9.8
9.2
10
50.0
11.3
10.7
10.1
9.6
9.0
11 51.8 11.0
10.5
9.9 9.4 8.8
12 53.6 10.7
10.3
9.7 9.2 8.6
13 55.4 10.5
10.1
9.5 9.0 8.5
14 57.2 10.3
9.9 9.3 8.8 8.3
15
59.0
10.1
9.7
9.1
8.6
8.1
16 60.8 9.8 9.5 9.0 8.5 8.0
17 62.6 9.6 9.3 8.8 8.3 7.8
18 64.4 9.4 9.1 8.6 8.2 7.7
19 66.2 9.2 8.8 8.5 8.0 7.6
20
68.0
9.1
8.7
8.3
7.8
7.4
21 69.8 8.9 8.6 8.1 7.7 7.3
22 71.6 8.7 8.4 8.0 7.6 7.1
23 73.4 8.6 8.3 7.9 7.4 7.0
24 75.2 8.4 8.1 7.7 7.3 6.9
25
77.0
8.2
8.0
7.6
7.2
6.7
26 78.8 8.1 7.8 7.4 7.0 6.6
27 80.6 8.0 7.7 7.3 6.9 6.5
28 82.4 7.8 7.6 7.1 6.8 6.4
29 84.2 7.7 7.4 7.0 6.6 6.3
30
86.0
7.6
7.3
6.9
6.5
6.1
31 87.8 7.4 7.1 6.7 6.4 6.0
32 89.6 7.3 7.0 6.6 6.3 5.9
33 91.4 7.2 6.9 6.5 6.2 5.8
34 93.2 7.1 6.8 6.5 6.1 5.7
35
95.0
7.0
6.7
6.4
6.0
5.6
36 96.8 6.8 6.5 6.2 5.9 5.5
37 98.6 6.7 6.4 6.1 5.8 5.4
38 100.4 6.6 6.3 6.0 5.7 5.3
39 102.2 6.5 6.3 5.9 5.6 5.2
40
104.0
6.4
6.3
5.8
5.5
5.2