Vanguard LTCA-10, LTCA-40, WRM-10P, WRM-40 User Manual
Page 32
LTCA VERSION 2.xx SOFTWARE MANUAL
REV 3
30
4.6
Working With Test Results Graphs
4.6.1. Changing the Graph’s Y-Axis Scale Type
The default graph view displays the Y-axis values using a linear scale. You can view the graph
using a logarithmic scale by selecting “Logarithmic” from the drop-down menu in the “Graph”
section of the application ribbon:
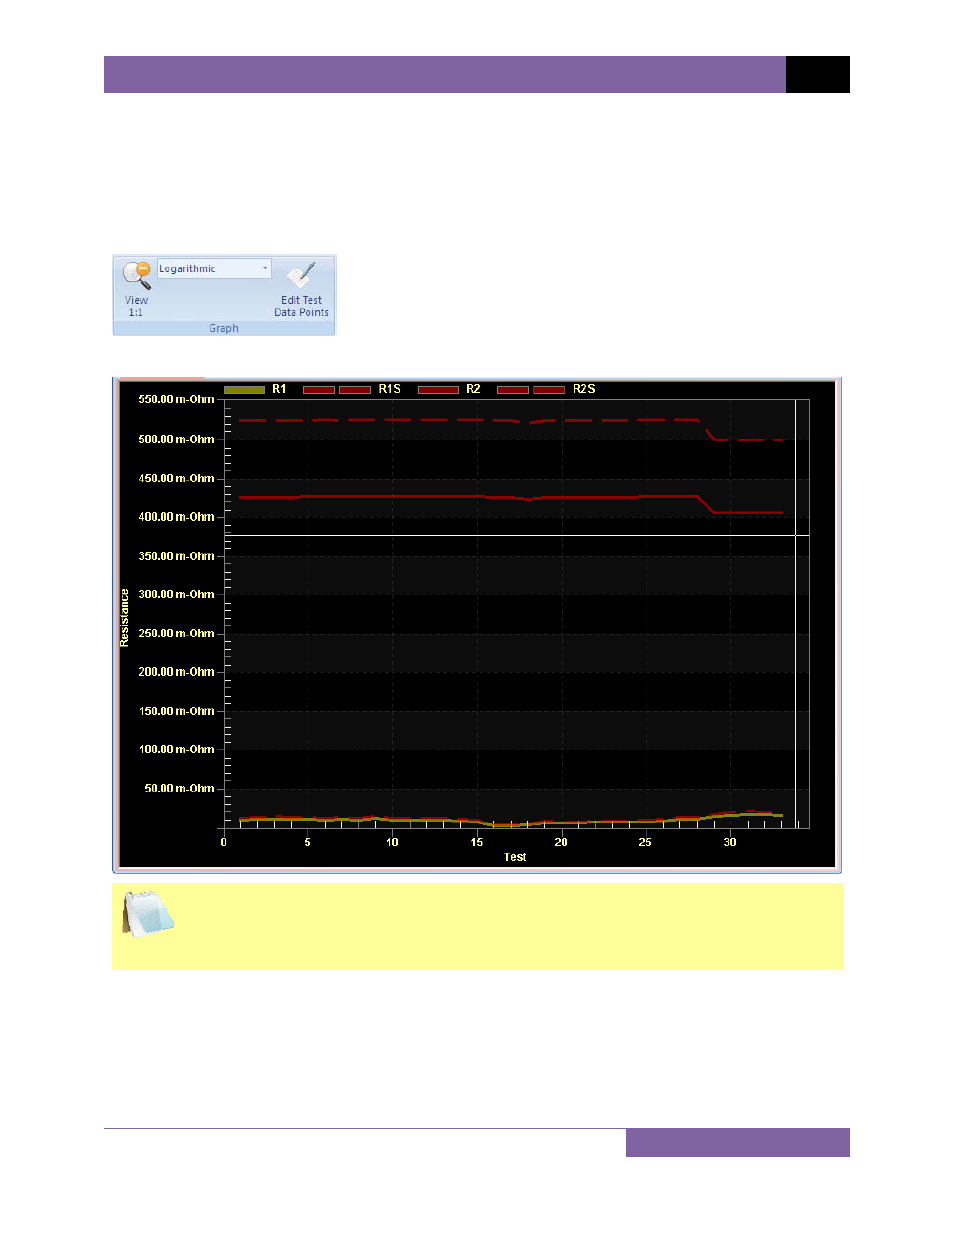
Following is a sample of a static test graph displayed using a linear scale:
NOTE
In linear scale mode, the graph is scaled between the minimum and maximum
resistance values.