Vanguard CT-8000 User Manual
Page 66
CT-8000 USER’S MANUAL
REV 2
61
Press the
[2]
key to print the tabulated results WITH the full graph of the results.
You will be returned to the “START-UP” menu when printing is finished. A typical
test result graph is shown in Figure 21.
3. PLOT EXPANSION
Press the
[3]
key to print the tabulated results along with a time expansion plot of
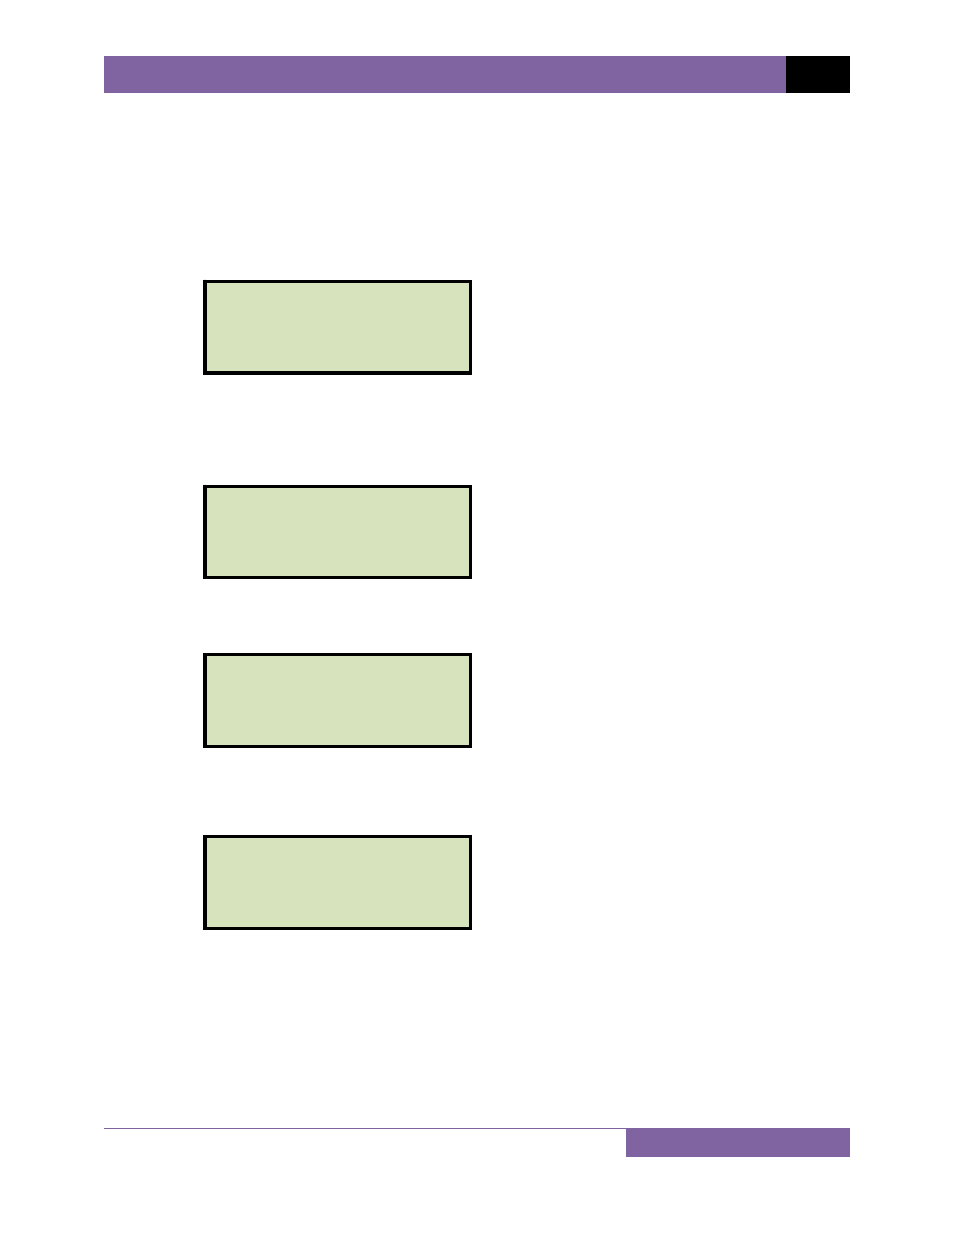
the test results. The following screen will be displayed:
You will be asked to enter the start point for the expansion. The start point can be
selected in 100 millisecond increments by typing the first digit of the starting time.
For example, to select 500ms, simply press the
[5]
key. The screen will be updated
as shown:
Press the
[ENTER]
key.
The following screen will be displayed:
Enter the end point for the expansion by typing the first digit of the 100 millisecond
increment. For example, to select 900ms, press the
[9]
key. The screen will be
updated as shown:
Press the
[ENTER]
key.
The graph expansion will be printed along with the tabulated test results. You will
be returned to the “START-UP” menu when printing is finished. A sample expansion
graph is shown in Figure 22.
4. PLOT 0 – 200MS
Press the
[4]
key to print the tabulated test results along with the graphic test
results from 0 – 200 milliseconds. The graph and tabulated results will be printed
EXPANSION TO:
900MS
“ENTER” TO CONFIRM
EXPANSION TO:
“ENTER” TO CONFIRM
EXPANSION FROM:
500MS
“ENTER” TO CONFIRM
EXPANSION FROM:
“ENTER” TO CONFIRM