Solidtron, N-type semiconductor discharge switch, thinpak, Typical performance curves – Silicon Power CCS TA 43N40_N-Type Semiconductor Discharge Switch, ThinPak User Manual
Page 3: Figure 3. predicted i, Is assumed to be at 25, The device junction temperature t
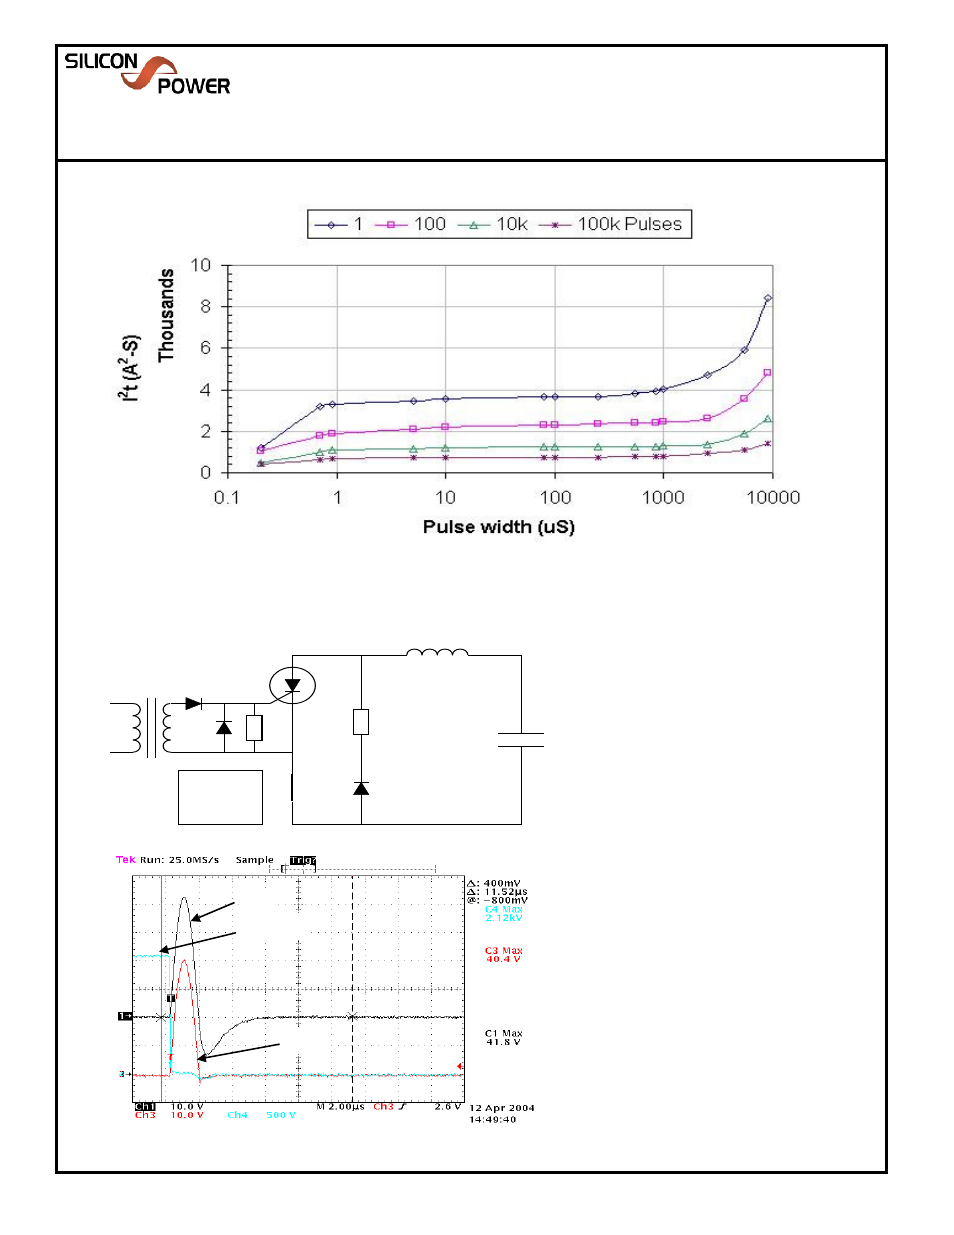
Typical Performance Curves
(Continued)
Figure 3. Predicted I
2
t data for various number of discharge cycles. Pulses are assumed rectangular.
The device junction temperature T
J
is assumed to be at 25
o
C before each discharge event.
275 Great Valley Parkway
Malvern, PA 19355
Ph: 610-407-4700
CCSTA43N40A10
Solidtron
TM
N-Type Semiconductor Discharge Switch, ThinPak
TM
The device junction temperature T
J
is assumed to be at 25
o
C before each discharge event.
Test Circuit
Figure 4. Typical test circuit and waveforms.
CAO 05/28/09
L
SERIES(TOTAL)
can be
caculated using
equation 1 / (f 2π)
2
C where f = frequency of I
K
when using CCSTA43N40 for circuit set up and
calibration.
The waveform shown is representative of one
produced using the test circuit shown where the
DUT is the CCSTA43N40 Solidtron.
The C1
capacitor voltage in this example was at 3750V.
Ik peaked at 4kA at 1us and the peak gate
current Ig is 1A.
I
C1
V
A-K DUT
I
k DUT
R
1
D
2
D
1
L
1
C
1
DUT
D
4
D
3
R
2
T
1
R
1
=1 ohm
R
2
=10 ohms
C
1
=6 uF
L
1
~45uH
CAO 05/28/09