Fig. 5-7 pc-link statistics window, Table 5.8 statistical values – Gentec-EO P-LINK User Manual
Page 17
P-
LINK User’s Manual Revision 15.0
17
Gentec Electro
– Optics, Inc. All rights reserved
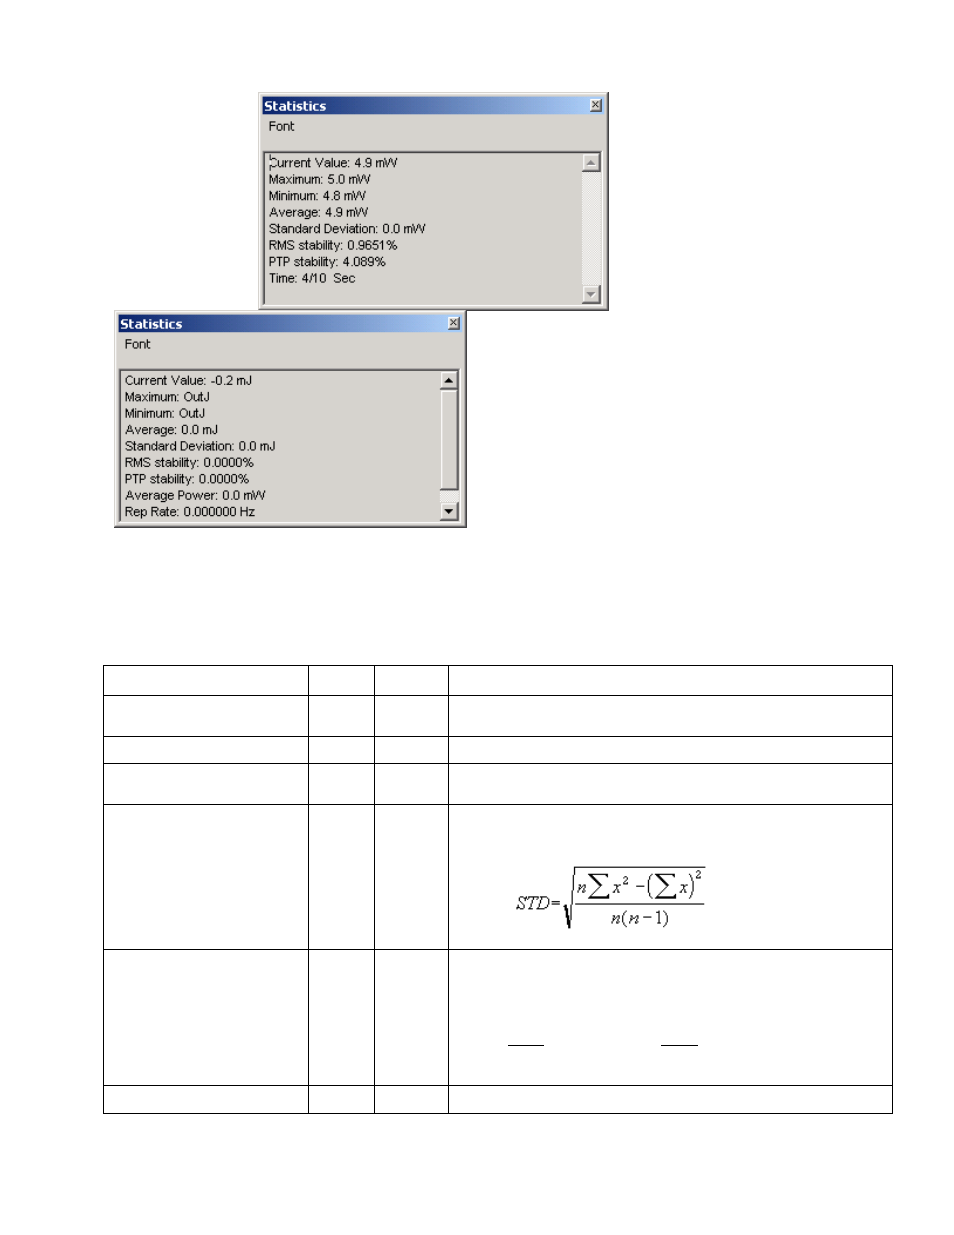
Fig. 5-7 PC-LINK Statistics Window
Table 5.8 Statistical values
Statistical Parameters
Power Energy
Definition
Maximum value
Highest value in the sample period, E
max
or
P
max
Minimum value
Lowest value in the sample period, E
min
or P
min
Average value
Rolling average of values in the sample, E
avg
or P
avg
Standard Deviation
A measure of the spread of the data around
the average.
RMS stability
Root mean square stability represents the
standard deviation as a percent of the
average.
100
avg
E
STD
RMS
,
100
avg
P
STD
RMS
PTP Stability
Shows the spread between the highest and