Data collection and analysis – PASCO OS-8542 BLACK BODY LIGHT SOURCE User Manual
Page 16
Black Body Instruction Manual
012-07105B
12
Data Collection and Analysis
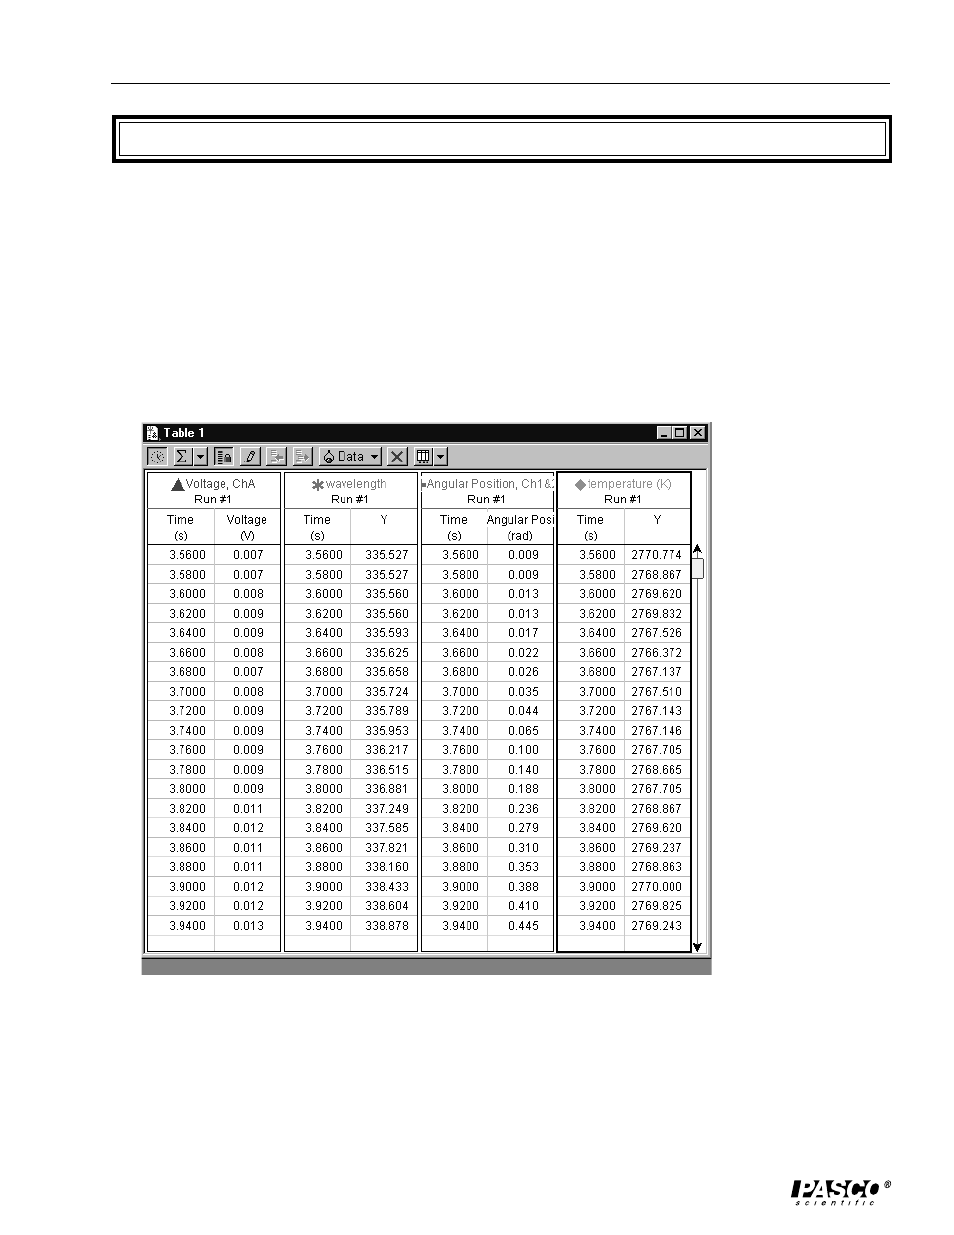
When you are ready to scan the spectrum, click the Start button in the DataStudio setup window. Data
Studio records the results and automatically performs the calculations for you. When you have finished
collecting your data, click the Stop button and view your results in either a graph or a table. If
necessary, you can view voltage, wavelength, angle and temperature data points all in the same run.
To view individual data points in a table, doubleclick to open a table icon, click on a colored data run
icon, and drag and drop the colored data run into the table. (For more information about data analysis
using DataStudio, refer to the DataStudio online help guide.)
Sample Data
See also other documents in the category PASCO Equipment:
- UI-5000 850 Universal Interface Quick Start (1 page)
- UI-5000 850 Universal Interface Instruction Manual (24 pages)
- PS-2193 High Current Sensor (2 pages)
- ME-8979 Mass and Hanger Set (1 page)
- ME-9498A Photogate Head (3 pages)
- ME-6821A Photogate Mounting Bracket (2 pages)
- ME-6825A MINI LAUNCHER (39 pages)
- ME-6810 Time of Flight Accessory (24 pages)
- ME-8574 DISCOVER FRICTION ACCESSORY (4 pages)
- PS-2103A Motion Sensor (4 pages)
- PS-2189 High Resolution Force Sensor (2 pages)
- ME-9448B Super Pulley with Clamp (2 pages)
- ME-6955 1.2 m PAScar Dynamics System (27 pages)
- PS-2104 Force Sensor (2 pages)
- ME-8998 Elastic Bumper Kit (2 pages)
- ME-6843 Spring Cart Launcher (9 pages)
- ME-6950 PAScar with Mass (29 pages)
- PS-2120A Rotary Motion Sensor (9 pages)
- PS-2120A Rotary Motion Sensor (17 pages)
- ME-9821 Centripetal Force Pendulum (18 pages)
- ME-8088 Centripetal Force Apparatus (20 pages)
- ME-8735 Large Rod Stand (2 pages)
- CI-6545 Force Accessory Bracket (3 pages)
- ME-9806 Photogate Brackets (1 page)
- CI-6692 IDS MOUNT ACCESSORY (2 pages)
- ME-6569 RMS_IDS KIT (36 pages)
- ME-6829 Mini Launcher Ballistic Pendulum (18 pages)
- ME-9889 Discover Free Fall System (10 pages)
- SE-7256 Motion Sensor Guard (2 pages)
- ME-8973 Discover Collision Bracket (2 pages)
- AP-8214A Stress_Strain Apparatus (12 pages)
- CI-6691 MINI-ROTATIONAL ACCESSORY (2 pages)
- ME-9833 Physical Pendulum Set (30 pages)
- OS-8473 POLARIZER SET (2 pages)
- PS-2343 USB Camera (2 pages)
- AP-8215A Gravitational Torsion Balance (20 pages)
- OS-8526A X-Y ADJUSTABLE DIODE LASER (2 pages)
- Xplorer-GLX Users’ Guide (152 pages)
- PS-2150 Broad Spectrum Light Sensor (2 pages)
- PS-2164 Quad Pressure Sensor (3 pages)
- PS-2200 Load Cell, 100 N (3 pages)
- PS-2205 Dual Load Cell Amplifier (5 pages)
- PS-2107 Absolute Pressure Sensor (2 pages)
- PS-2102 pH Sensor (3 pages)
- PS-2119 Acceleration Sensor (2 pages)