About the sensor, Trigger settings, Front panel indicators – PASCO PS-2190 1 MHz 2-channel Voltage Sensor User Manual
Page 3
®
1 M H z 2 - c h a n n e l V o l t a g e S e n s o r
P S - 2 1 9 0
3
The sample rate is linked to the time resolution on the horizontal
axis. For example, when the horizontal axis scale is 0 to 10 ms,
the sample rate in the Sensor Settings screen is 20,000 Hz. When
the horizontal scale is 0 to 5 ms, the sample rate is 50,000 Hz.
When the horizontal scale is 0 to 2 ms, the sample rate is 100,000
Hz. When the horizontal scale is 0 to 2
µs, the sample rate is
1,000,000 Hz.
Use of this dynamic sample rate adjustment accomplishes two
purposes: It simplifies adjustment of the Graph to obtain a good
representation of the input and it allows the sensor to perform
averaging of the input signal at lower sample rates and thereby
reduce noise that might be part of the signal.
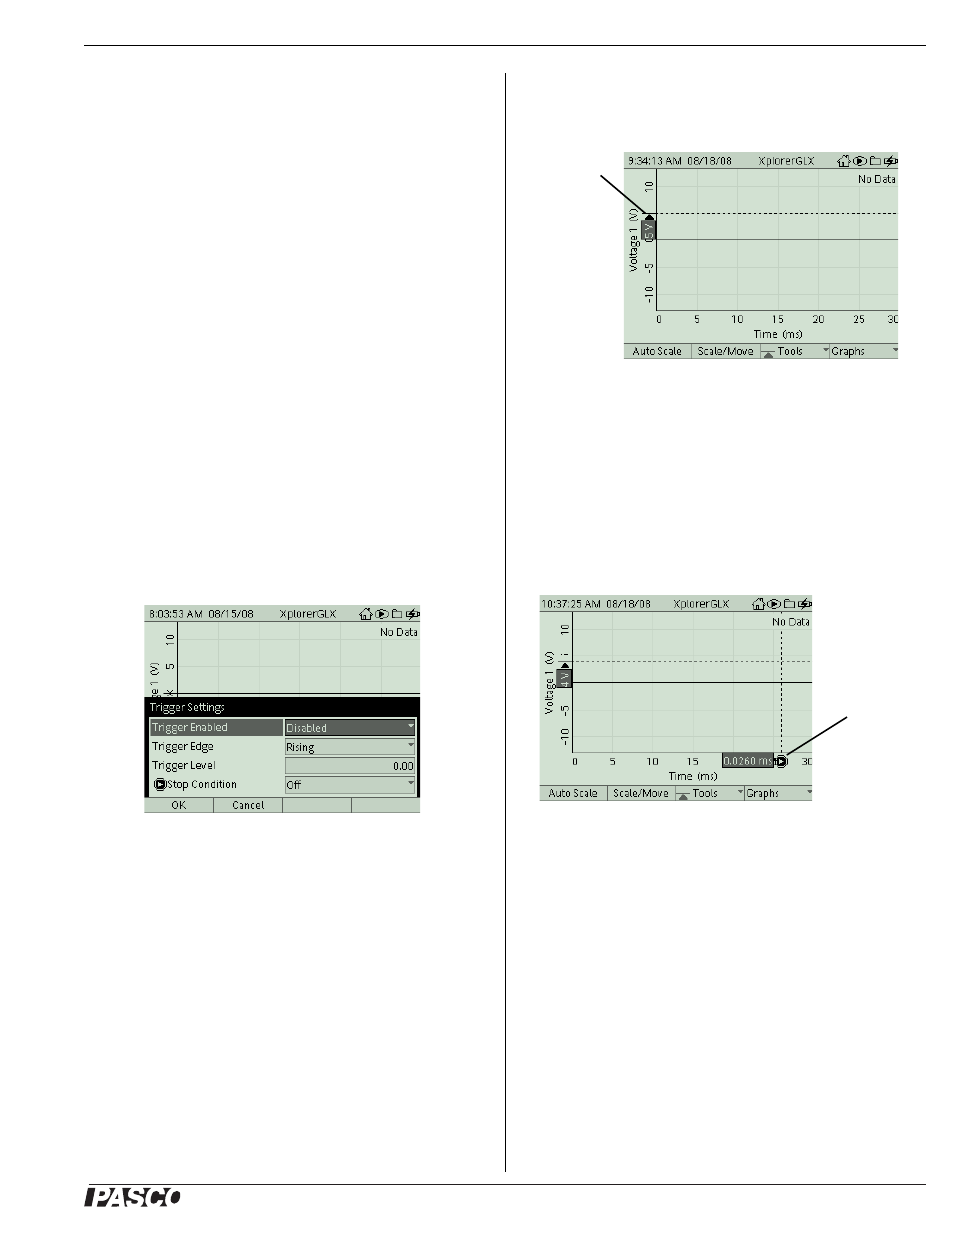
Trigger Settings
The Trigger choice in the ‘Tools’ menu is automatically selected
when you select Scope Mode. Press the F3 (H) button to open
the Tools menu. The Trigger is a tool that allows you to control
how the GLX collects data. With the Trigger, you make the GLX
delay data recording (after you press s) until a certain condi-
tion is met by the incoming data. The Trigger has two parame-
ters: Trigger Edge, which can be ‘Rising’ or ‘Falling’, and
Trigger Level, which specifies the data value that must be
crossed. Press the left arrow cursor button (l) to open the Trig-
ger Settings dialog box (you can also select it from the Tools
menu). By default, the Trigger is ‘Disabled’, the Trigger Edge is
‘Rising’, the Trigger Level is ‘0.00’ and the Stop Condition is
‘Off’.
Use the up or down cursor buttons to highlight your choice and
then press the check button (c) to change the selection (e.g.,
from ‘Disabled’ to ‘Enabled’). When the Trigger is ‘Enabled’, an
arrow appears along the vertical axis at the Trigger Level. For
Trigger Level, press the check button to highlight the numeric
value and use the alphanumeric key pad to enter a new value and
then press c again. Press the F1 (F) button to select ‘OK’
or the F2 (G) button to select ‘Cancel’.
Trigger in the Graph Display
The Trigger can be used in normal graph mode to start continu-
ous recording, or it can be used in Scope Mode to repeatedly trig-
ger bursts of data collection. In both modes, the Graph must have
time on the horizontal axis.
Use the up arrow cursor button to increase the Trigger Level. Use
the down arrow cursor button to decrease the Trigger Level. A
horizontal dashed line appears on the graph indicating the Trigger
Level.
Press the right arrow cursor button to cycle through ‘Rising’
edge, ‘Falling’ edge, and ‘Disabled’
Stop Condition
When the Stop Condition is turned on, data collection stops auto-
matically when the GLX reaches the right-hand edge of the
Graph. To turn on the Stop Condition in the Trigger Settings
screen, use the arrow cursor buttons to highlight Stop Condition
and press c. When the Stop Condition is on, an icon and a ver-
tical dashed line appear on the Graph indicating the stop time.
While viewing the Graph, hold e and press the left and right
cursor arrow buttons to adjust the stop time. The amount of data
collected is determined by the Graph’s time scale.
About the Sensor
Front Panel Indicators
The front panel has two light-emitting diode (LED) indicators.
The green LED indicates ‘power on’ when the sensor is con-
nected to the Xplorer GLX datalogger. The yellow LED lights
whenever the sensor detects a signal that meets the trigger
requirements set up in the GLX.
Figure 6: Trigger Settings
Figure 7: Trigger Level
‘Rising’
edge
Stop Condition
icon
Figure 8: Stop Condition