PASCO PS-2138 Goniometer User Manual
Page 22
Goniometer
Experiment Teachers' Notes and Sample Data
22
®
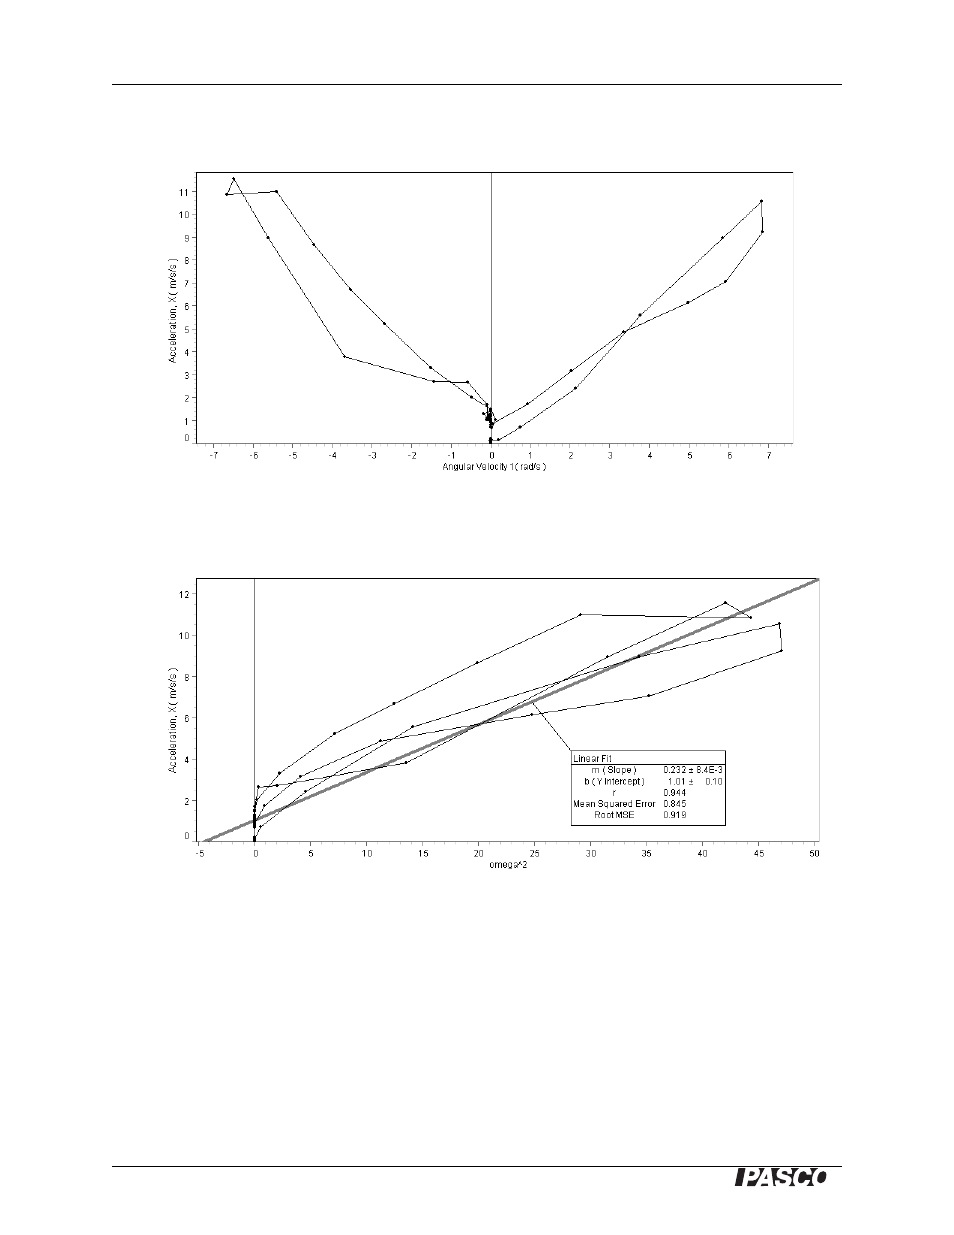
7) When
ω was negative, a
C
was positive, therefor the centripetal
acceleration was toward the elbow.
8) In theory, the graph of a
C
versus
ω is a parabola. Though the data
contains a lot of scatter, that relationship is evident in the collected
data.
9) On the graph of a
C
versus
ω
2
, the slope of the best-fit line is the
theoretical value of r, in this case 0.232 m ± 0.008 m.
10) The theoretical and actual values of r differ by about 55%.
In Part 3, your students will probably find that the values of r according to
the best-fit lines differ significantly from the actual value; and that the
graphs themselves contain significant scatter or noise.
Have them compare the different sensors, procedures, and mathematics
(including the calculations done inside the sensor) used in each part of the